The Particle Swarm Optimisation for Spectral Matching Applied to Inland... Remote Sensing
advertisement
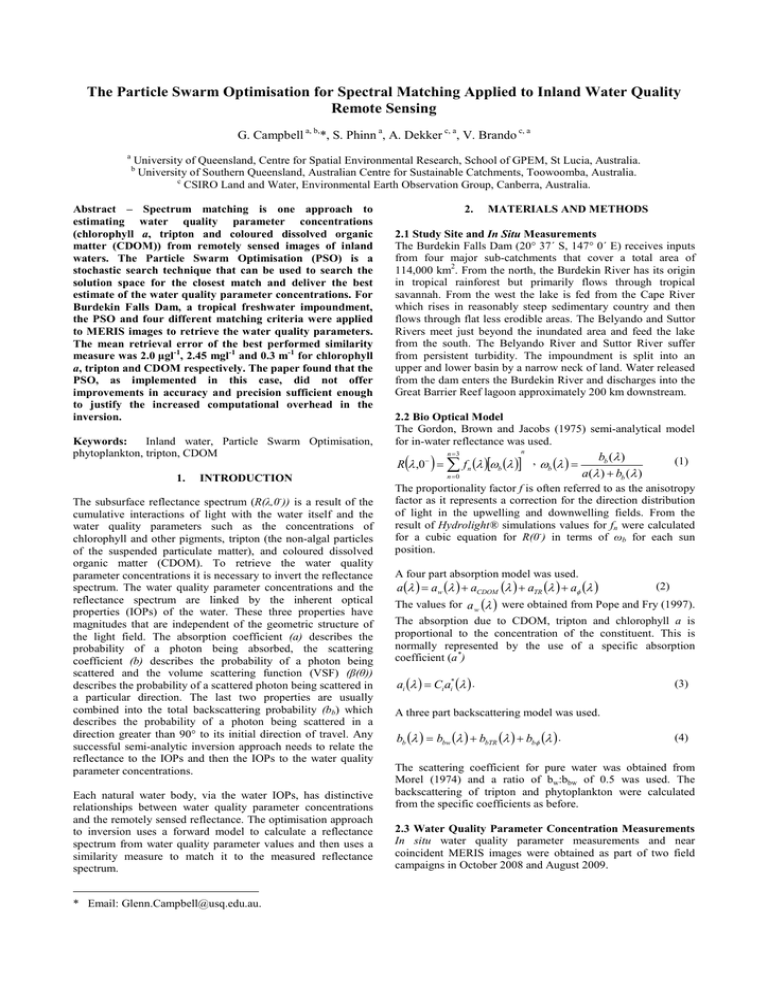
The Particle Swarm Optimisation for Spectral Matching Applied to Inland Water Quality Remote Sensing G. Campbell a, b,*, S. Phinn a, A. Dekker c, a, V. Brando c, a a University of Queensland, Centre for Spatial Environmental Research, School of GPEM, St Lucia, Australia. University of Southern Queensland, Australian Centre for Sustainable Catchments, Toowoomba, Australia. c CSIRO Land and Water, Environmental Earth Observation Group, Canberra, Australia. b Abstract – Spectrum matching is one approach to estimating water quality parameter concentrations (chlorophyll a, tripton and coloured dissolved organic matter (CDOM)) from remotely sensed images of inland waters. The Particle Swarm Optimisation (PSO) is a stochastic search technique that can be used to search the solution space for the closest match and deliver the best estimate of the water quality parameter concentrations. For Burdekin Falls Dam, a tropical freshwater impoundment, the PSO and four different matching criteria were applied to MERIS images to retrieve the water quality parameters. The mean retrieval error of the best performed similarity measure was 2.0 µgl-1, 2.45 mgl-1 and 0.3 m-1 for chlorophyll a, tripton and CDOM respectively. The paper found that the PSO, as implemented in this case, did not offer improvements in accuracy and precision sufficient enough to justify the increased computational overhead in the inversion. Keywords: Inland water, Particle Swarm Optimisation, phytoplankton, tripton, CDOM 1. INTRODUCTION The subsurface reflectance spectrum (R(λ,0-)) is a result of the cumulative interactions of light with the water itself and the water quality parameters such as the concentrations of chlorophyll and other pigments, tripton (the non-algal particles of the suspended particulate matter), and coloured dissolved organic matter (CDOM). To retrieve the water quality parameter concentrations it is necessary to invert the reflectance spectrum. The water quality parameter concentrations and the reflectance spectrum are linked by the inherent optical properties (IOPs) of the water. These three properties have magnitudes that are independent of the geometric structure of the light field. The absorption coefficient (a) describes the probability of a photon being absorbed, the scattering coefficient (b) describes the probability of a photon being scattered and the volume scattering function (VSF) (β(θ)) describes the probability of a scattered photon being scattered in a particular direction. The last two properties are usually combined into the total backscattering probability (bb) which describes the probability of a photon being scattered in a direction greater than 90° to its initial direction of travel. Any successful semi-analytic inversion approach needs to relate the reflectance to the IOPs and then the IOPs to the water quality parameter concentrations. Each natural water body, via the water IOPs, has distinctive relationships between water quality parameter concentrations and the remotely sensed reflectance. The optimisation approach to inversion uses a forward model to calculate a reflectance spectrum from water quality parameter values and then uses a similarity measure to match it to the measured reflectance spectrum. * Email: Glenn.Campbell@usq.edu.au. 2. MATERIALS AND METHODS 2.1 Study Site and In Situ Measurements The Burdekin Falls Dam (20° 37´ S, 147° 0´ E) receives inputs from four major sub-catchments that cover a total area of 114,000 km2. From the north, the Burdekin River has its origin in tropical rainforest but primarily flows through tropical savannah. From the west the lake is fed from the Cape River which rises in reasonably steep sedimentary country and then flows through flat less erodible areas. The Belyando and Suttor Rivers meet just beyond the inundated area and feed the lake from the south. The Belyando River and Suttor River suffer from persistent turbidity. The impoundment is split into an upper and lower basin by a narrow neck of land. Water released from the dam enters the Burdekin River and discharges into the Great Barrier Reef lagoon approximately 200 km downstream. 2.2 Bio Optical Model The Gordon, Brown and Jacobs (1975) semi-analytical model for in-water reflectance was used. n =3 n R λ ,0− = ∑ f n (λ )[ωb (λ )] , ωb (λ ) = ( ) n =0 bb (λ ) a(λ ) + bb (λ ) (1) The proportionality factor f is often referred to as the anisotropy factor as it represents a correction for the direction distribution of light in the upwelling and downwelling fields. From the result of Hydrolight® simulations values for fn were calculated for a cubic equation for R(0-) in terms of ωb for each sun position. A four part absorption model was used. a (λ ) = aw (λ ) + aCDOM (λ ) + aTR (λ ) + aφ (λ ) (2) The values for a w (λ ) were obtained from Pope and Fry (1997). The absorption due to CDOM, tripton and chlorophyll a is proportional to the concentration of the constituent. This is normally represented by the use of a specific absorption coefficient (a*) ai (λ ) = Ci ai* (λ ) . (3) A three part backscattering model was used. bb (λ ) = bbw (λ ) + bbTR (λ ) + bbφ (λ ) . (4) The scattering coefficient for pure water was obtained from Morel (1974) and a ratio of bw:bbw of 0.5 was used. The backscattering of tripton and phytoplankton were calculated from the specific coefficients as before. 2.3 Water Quality Parameter Concentration Measurements In situ water quality parameter measurements and near coincident MERIS images were obtained as part of two field campaigns in October 2008 and August 2009. Figure 1. Location of the validation sample sites for the October 2008 (left) and the August 2009 (right) fieldwork activities. 2.3.1 Laboratory Measurements October 2008 Measurements During October 2008 the IOPs of the storage were measured at eleven stations (see Figure 1). Water samples were taken from approximately 0.3 m below the surface and kept cool for later laboratory measurement of tripton (TR), chlorophyll a (CHL) concentration and CDOM concentration and spectral absorption. A detailed description of the of the IOP measurements, water quality parameter measurements and subsequent SIOP domain calculation is provided in Campbell et al. (2011). August 2009 Measurements A second field campaign was conducted in August 2009 fieldwork to obtain a larger validation dataset for chlorophyll a that was independent of the measurements used to parameterise the algorithm. Water samples were taken from approximately 0.3 m below the surface at 25 observations stations (shown in Figure 1). Two replicates were prepared for each water sample by filtering through a 47 mm diameter GF/F glass-fibre filter (Whatman, nominal pore size; 0.7 µm) and then freezing the filter. The pigments were measured using the US EPA method 445.0 (Arar & Collins 1997). This method measures the combined concentrations of chlorophyll a and pheophytin a. With the aid of HPLC analysis, no pheophytin a was detected in the October 2008 samples so it is assumed that the measured concentration is only that of chlorophyll a. 2.4 Particle Swarm Optimisation (PSO) The PSO is the stochastic search technique which includes a random element in the search approach that was first applied to ocean colour by Slade et al. (2004). The algorithm represents the solution as an n-dimensional vector in an n-dimensional solution space. It then mimics the action of a swarm by generating a number of potential solutions or ‘particles’ and after each iteration having them react to the closest match in its local area as well as the best match from all the particles. The best match can be defined by any appropriate cost function or similarity measure. Let xj be a particle and the position of xj after the next iteration as xj+∆xj where ∆xj is referred to as the trajectory. The trajectory is related to the value of two vectors, the vector connecting xj to the best match that it has previously made (xj,best) and the vector connecting xj to the best match that any of the particles have made (xG,best). The random element is introduced by generating random number multiples of the components of xj,best and xG,best. The bias towards each component vector is controlled by two weight constants c1 and c2. To aid in the convergence the sum of the vectors is multiplied by a constriction factor χ. Formally, x j (t + 1) = x j (t ) + ∆x j (t + 1) (5) ∆x j (t + 1) = χ (∆x j (t ) + Φ1 (x j,best − x j (t )) + Φ2 (xG,best − x j (t ))) (6) In this case the search space is three dimensional so rm,1 0 Φ m = cm 0 rm, 2 0 0 0 0 rm,3 where rm,i are random scalars uniformly distributed between 0 and 1. χ= 2 φ = c1 + c2 , φ > 4 (7) 2 2 − φ − φ − 4φ The φ > 4 restriction is required to prevent the values of the trajectories from becoming cyclical and hence not randomly searching the solution space (Clerc & Kennedy 2002). The parameters c1 and c2 were set at 2.05 (Slade et al. 2004) and a swarm of 27 particles was used. 2.5 Similarity Measures The PSO determines the direction of the search based on the values of the best spectrum match. Four similarity measures and were tested to see which returned the most accurate and precise results. 2.5.1 Spectral Angle Mapper The Spectra Angle Mapper (SAM) measure treats the two spectra as n-dimensional column vectors and uses their dot product normalised for the magnitude of the vectors as a measure of their similarity. Formally, let x and x' be two spectra with n bands then SAM (x, x′) = cos −1 n n ∑i =1 xi2 ⋅ ∑i =1 xi′2 ∑ n i =1 xi xi′ (8) 2.5.2 Spectral Information Divergence The Spectral Information Divergence (SID) is a stochastic rather than deterministic measure of similarity (Du et al. 2004). It reduces the vectors to probability vectors before comparing them. This is achieved by normalising the vector by dividing by the sum of its components. For a given band this probability can be converted into its self-information. In broad terms this describes the unlikeliness of the predicted outcome. The discrepancy in a particular band is the difference between the self information of the comparable bands in the two spectra. The discrepancy of the spectra is the sum of the band discrepancy weighted by that band’s probability. For this reason the discrepancy is not commutative so the SID is calculated as the sum of the discrepancies of the two combinations. Formally, let x and x' be two spectra with n bands with probability vectors p and q respectively. The probability for a given band is: pi = xi and the self-information for each band is ∑i =1 xi n I i (x ) = − log( pi ) . The discrepancy of a band is p Di (x x′) = I i (x ) − I i (x′) = log i and the discrepancy of the qi n p (9) spectra is D(x x′) = pi log i . ∑ i =1 qi Lastly, SID(x, x′) = D(x x′) +D(x′ x ) (10) 2.5.3 Spectral Correlation Mapper The Spectral Correlation Mapper (SCM) is a modification of the SAM that takes into account the sign of the correlation not just the magnitude (Carvalho & Menezes 2000). SCM (x, x′) = cos −1 ∑ (x − x )(x′ − x ′) ∑ (x − x ) ⋅ ∑ (x′ − x ′) n i =1 n i =1 i i (11) n i i =1 i 2.5.4 Minimum Distance The three previous measures mathematically eliminate the magnitude of the reflectance spectra from the calculation and focus on its shape. However, as the tripton concentration increases in water, the increased scattering leads the reflectance spectra to increase in magnitude rather than change in shape. The minimum distance measure only considers the magnitude of the two spectra by calculating the Euclidean distance between their vectors in band space. MIN (x, x′) = ∑ (x n i =1 2 i − xi′2 ) (12) 2.6 Atmospheric Correction The c-WOMBAT-c software (Brando & Dekker 2003) was used, but was modified to use the 6S radiative transfer model and the Thuillier et al. (2003) reference sun irradiance spectrum. The c-WOMBAT-c approach corrects for the adjacency effect by applying an n x n low pass filter to the image to supply an average radiance (Lrs,b) image. A value of n = 9 was adopted, resulting in a 2.7 km x 2.7 km adjacency window. The aerosol optical thickness (AOT) was estimated by taking advantage of the homogeneity of aerosols over small spatial scales of 50-100 kms (Vidot & Santer 2005) to calculate the AOT over adjoining dense dark vegetation (DDV) and then applying this value to the water body. The Vidot and Santer approach assumes that the reflectance value of the dense dark vegetation (DDV) in the blue and red regions is known and uses these values to identify the aerosol type and retrieve the aerosol optical thickness. In this work the aerosol type was selected based on the water body location and the prevailing wind conditions prior to the image acquisition. The reference DDV values for three bands (412, 443 and 665 nm), corrected for the BRDF effects using the Leroy et al. (1998) model, were extracted from the MERIS auxiliary files. Image pixels were designated as DDV pixels if their Atmospherically Resistant Vegetation Index (ARVI) (Kaufman & Tanre 1992) was above a given threshold. A simple ARVI threshold is prone to select normal vegetation that is shadowed by cloud at the time of the image acquisition. The reflectance value in the 865 nm band was used to separate cloud shadow from DDV using a minimum reflectance of 17% and a subset of image pixels that represented the highest 0.5% of ARVI values was selected. The DDV pixel subset was averaged to get the DDV spectrum for that AOT value. The AOT value was iterated until the image DDV value matched the reference DDV. 3. RESULTS 3.1 October 2008 Results A MERIS full resolution image was obtained for 15th October 2008. The image was corrected for the influence of the atmosphere and the PSO was applied to produce concentration maps for the three water quality parameters. The retrieved values were compared to the in situ observations and the mean error was calculated and shown in Table 1. Table 1. The means of the absolute values of error between the laboratory measured concentrations and those retrieved from the 15th October 2008 image for selected matching criteria. Chl (µgl-1) TR (mgl-1) CDOM(m-1) Av SD Av SD Av SD SID 3.27 3.32 14.5 9.03 1.31 0.69 SAM 3.72 3.32 14.3 8.98 1.28 0.70 Min Dist 4.07 2.70 3.35 2.29 0.30 0.26 SCM 4.65 1.78 2.45 2.11 0.33 0.21 The SID and SAM criteria performed very poorly with respect to the estimation of tripton and CDOM concentration. Both these criteria mathematically eliminate the magnitude of the reflectance spectra from the calculation and focus on its shape. The SCM produced statistically significantly better retrievals for the tripton and CDOM water quality parameters. The SCM is a modification of the SAM that takes into account sign of the correlation not just the magnitude (Carvalho & Menezes 2000). Investigation of the optical closure between the measured and forward modelled spectra showed differences were equally distributed either side of a 560 nm peak. Perhaps the ability to ‘balance’ the misclosure has led to a more reliable result. Notwithstanding the mean error, it should be noted that the SCM returned the greatest number of physically impossible negative concentrations for chlorophyll a. 3.2 August 2009 Results An MERIS full resolution image was obtained for 13th August 2009. The image was corrected for the influence of the atmosphere and the PSO was applied to produce concentration maps for the three water quality parameters. The retrieved values for chlorophyll a were compared to the in situ observations and the mean error was calculated and shown in Table 2. Table 2. The means of the absolute values of error between the laboratory measured concentrations and those retrieved from the 13th August 2009 image for selected matching criteria. Chl (µgl-1) Av SD SID 1.52 1.11 SAM 1.68 1.26 1.07 Min Dist 2.22 1.85 1.56 SCM The SID, SAM and SCM similarity measures were equally good at retrieving chlorophyll a and the SID measure performed statistically significantly better than the minimum distance criterion. 4. CONCLUSIONS If the two validation sets are pooled the SID similarity measure had a mean error of chlorophyll a retrieval of 2.0 µgl-1, the SAM criterion 2.3 µgl-1 and the minimum distance and SCM criteria both had a mean error of 2.7 µgl-1. A number of caveats should be attached to these results. Firstly, the range of water quality parameter concentrations measured in the two field campaigns was limited, secondly, there is no way to evaluate the accuracy of the atmospheric correction on any particular image without some additional in situ data and lastly, it is not possible to be definitive about the accuracy when there is notable uncertainty in the ground truth values. The assessment of the average error for tripton and CDOM retrieval is covered by the same caveats as those mentioned for the chlorophyll a retrieval: that is, a limited range and uncertainty in the ground truth data. The best performed SCM criterion had a mean error of 2.5 mgl-1 and the minimum distance criterion had 3.4 mgl-1. The SID and SAM criteria were incapable of retrieving a credible tripton concentration. For CDOM it was found that the best performed minimum distance similarity measure had a mean error of 0.30 m-1 and the SCM criterion had a mean error of 0.33 m-1. Both these measures were superior to the SID and SAM measures. This paper has found that the PSO, as implemented with this reflectance model and similarity measures, does not offer improvements in accuracy and precision sufficient enough to justify the increased computational overhead of the inversion. This is not to say that the application of the method to a more accurate and complex reflectance model or a non-linear SIOP to IOP relationship or another similarity measure could not change the balance between the two considerations. REFERENCES Arar, EJ & Collins, GB 1997, Method 445.0, In Vitro Determination of Chlorophyll a and Pheophytin a in Marine and Freshwater Algae by Fluorescence, Revision 1.2., National Exposure Research Laboratory, Office of Research and Development, U.S. Environmental Protection Agency, Cincinnati, OH. Brando, VE & Dekker, AG 2003, 'Satellite hyperspectral remote sensing for estimating estuarine and coastal water quality', IEEE Transactions on Geoscience and Remote Sensing, vol. 41, no. 6, pp. 1378-87. Campbell, G, Phinn, SR & Daniel, P 2011, 'The specific inherent optical properties of three sub-tropical and tropical water reservoirs in Queensland, Australia.', Hydrobiologia, vol. 658, no. 1, pp. 233-52. Carvalho, OA & Menezes, PR 2000, 'Spectral Correlation Mapper (SCM): an improvement on the Spectral Angle Mapper', in Ninth JPL Airborne Earth Science Workshop, Jet Propulsion Laboratory, Pasadena, California, pp. 65-74. Clerc, M & Kennedy, J 2002, 'The particle swarm - explosion, stability, and convergence in a multidimensional complex space', IEEE Transactions on Evolutionary Computation, vol. 6, no. 1, pp. 58-73. Du, Y, Chang, C-I, Ren, H, Chang, C-C, Jensen, JO & D'Amico, FM 2004, 'New hyperspectral discrimination measure for spectral characterization', Optical Engineering, vol. 43, no. 8, pp. 1777-86. Gordon, HR, Brown, OB & Jacobs, MM 1975, 'Computed relationships between the inherent and apparent optical properties of a flat homogeneous ocean', Applied Optics, vol. 14, no. 2, pp. 417-27. Kaufman, YJ & Tanre, D 1992, 'Atmospherically resistant vegetation index (ARVI) for EOS-MODIS', Geoscience and Remote Sensing, IEEE Transactions on, vol. 30, no. 2, pp. 26170. Leroy, M, V., B-P, Hautecoeur, O, Bréon, FM & Baret, F 1998, Corrections atmosphériques des données MERIS/ENVISAT: caractérisations de la BRDF de surfaces “sombres”, European Space Agency final report. Morel, A 1974, 'Optical properties of pure water and pure seawater', in NG Jerlov & E Steeman Nielsen (eds), Optical Aspects of Oceanography, Academic, pp. 1-24. Pope, RM & Fry, ES 1997, 'Absorption spectrum (380 -700 nm) of pure water. II. Integrating cavity measurements', Applied Optics, vol. 36, no. 33, pp. 8710-23. Slade, WH, Ressom, HW, Musavi, MT & Miller, RL 2004, 'Inversion of ocean color observations using particle swarm optimization', IEEE Transactions on Geoscience and Remote Sensing, vol. 42, no. 9, pp. 1915-23. Thuillier, G, Hersé, M, Labs, D, Foujols, T, Peetermans, W, Gillotay, D, Simon, PC & Mandel, H 2003, 'The solar spectral irradiance from 200 to 2400 nm as measured by the SOLSPEC spectrometer from the Atlas and Eureca missions', Solar Physics, vol. 214, no. 1, pp. 1-22. Vidot, J & Santer, R 2005, 'Atmospheric correction for inland waters - application to SeaWiFS', International Journal of Remote Sensing, vol. 26, no. 17, pp. 3663-82. ACKNOWLEDGEMENTS The authors would like to thank CSIRO for aid in the field and laboratory work. We would like to thank Mr Paul Daniel for his assistance in the field operations, Lesley Clementson of CMAR for the 2008 laboratory measurements and to Britta Schaffelke and Michele Skuza of the AIMS in Townsville for the 2009 chlorophyll a measurements. We would like to thank the European Space Agency for providing the MERIS FR images under the AO 595 agreement. We would like to express our gratitude to the water body operators Sunwater for their assistance in the field operations.

