Experiment 9: Sound Waves Part One: Audible Sound.
advertisement

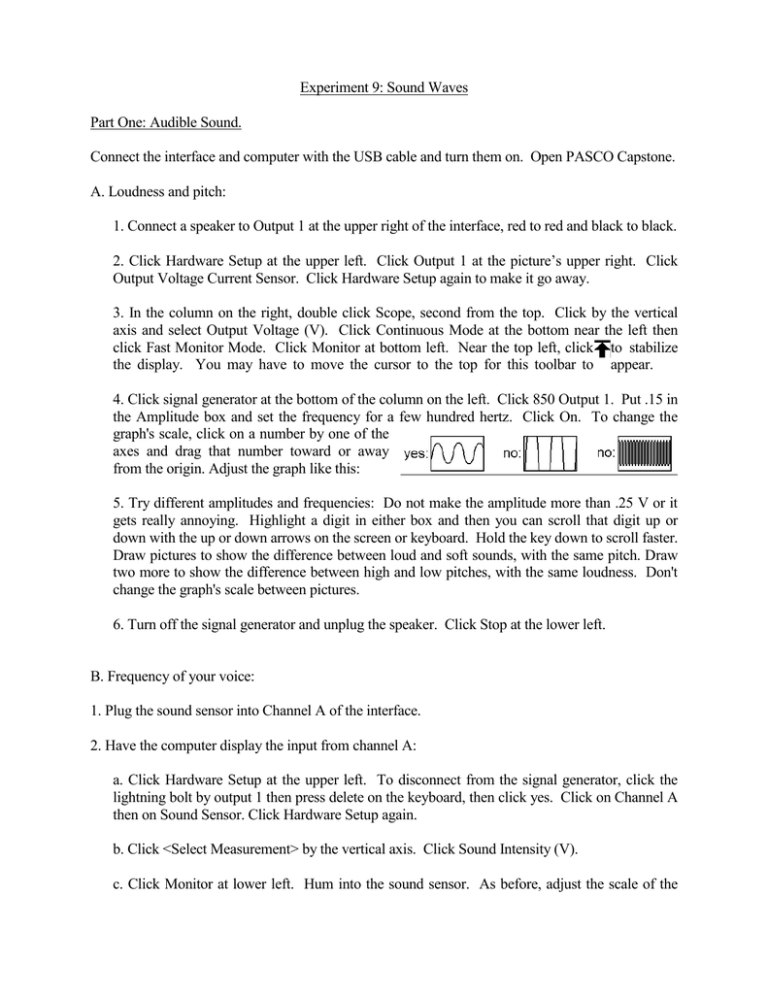
Experiment 9: Sound Waves Part One: Audible Sound. Connect the interface and computer with the USB cable and turn them on. Open PASCO Capstone. A. Loudness and pitch: 1. Connect a speaker to Output 1 at the upper right of the interface, red to red and black to black. 2. Click Hardware Setup at the upper left. Click Output 1 at the picture’s upper right. Click Output Voltage Current Sensor. Click Hardware Setup again to make it go away. 3. In the column on the right, double click Scope, second from the top. Click by the vertical axis and select Output Voltage (V). Click Continuous Mode at the bottom near the left then click Fast Monitor Mode. Click Monitor at bottom left. Near the top left, click to stabilize the display. You may have to move the cursor to the top for this toolbar to appear. 4. Click signal generator at the bottom of the column on the left. Click 850 Output 1. Put .15 in the Amplitude box and set the frequency for a few hundred hertz. Click On. To change the graph's scale, click on a number by one of the axes and drag that number toward or away from the origin. Adjust the graph like this: 5. Try different amplitudes and frequencies: Do not make the amplitude more than .25 V or it gets really annoying. Highlight a digit in either box and then you can scroll that digit up or down with the up or down arrows on the screen or keyboard. Hold the key down to scroll faster. Draw pictures to show the difference between loud and soft sounds, with the same pitch. Draw two more to show the difference between high and low pitches, with the same loudness. Don't change the graph's scale between pictures. 6. Turn off the signal generator and unplug the speaker. Click Stop at the lower left. B. Frequency of your voice: 1. Plug the sound sensor into Channel A of the interface. 2. Have the computer display the input from channel A: a. Click Hardware Setup at the upper left. To disconnect from the signal generator, click the lightning bolt by output 1 then press delete on the keyboard, then click yes. Click on Channel A then on Sound Sensor. Click Hardware Setup again. b. Click <Select Measurement> by the vertical axis. Click Sound Intensity (V). c. Click Monitor at lower left. Hum into the sound sensor. As before, adjust the scale of the graph so that it shows just a few periods and the amplitude takes up most of the vertical space. While humming, click Stop to freeze the picture. 3. Read the period from the graph, and then calculate the frequency from the period: Click at the top of the graph. Move the crosshairs to a point at the start of the interval. Right click, select Show Delta, then move the opposite corner of the rectangle to a point at the end of the interval. Right click on Δx then click Tool Properties to get more decimal places. C. Period of sound from a plastic flute. 1. Get a plastic flute from the jar of disinfectant at the front of the room. Rinse it off after use. Measure the period it produces with all of its holes open, as you did with your voice. A good place to hold the microphone is near the hole in the mouthpiece. Blowing softly or very hard affects the pitch somewhat. Try for moderately loud. 2. As a comparison to what you just measured, calculate the period from the flute's dimensions: The frequency is determined by a standing wave in the flute, whose wavelength is about twice the distance from the end to the first hole. So, a. Measure from the tip of the mouthpiece to the center of the first open round hole. b. Double this to get the wavelength. c. Use this and the speed of sound to calculate what the frequency should be. d. Find the period from the frequency. 3. Comment on how well the measured and calculated periods match. (The calculated value may be a little smaller than what you measured with the microphone, because step 2 is somewhat oversimplified. But, they should be within about 10 %.) Part two: Ultrasound. You will determine the speed of sound, by finding a sound’s frequency and wavelength. For a more pleasant environment, you will use a frequency above your range of hearing. You have two crystals, encased in little cans, which transduce electrical signals into mechanical vibrations and mechanical vibrations into electrical signals. You will use one as a "loudspeaker" (source) and the other as a "microphone" (receiver). 1. Plug the voltage sensor into channel A of the interface. Using alligator clips, attach it to a transducer, red to red, black to black. This will act as a microphone for ultrasound. Connect the other transducer to output channel 1, using wires with alligator clips. This is the speaker. Place the cans on the counter, facing each other. 2. Click Hardware Setup at the upper left. Delete the sound sensor. Click Input A and select Voltage Sensor. Click Output 1 and select Output Voltage Current Sensor. Click Hardware Setup. 3. Click Signal Generator. Put 10 V in the Amplitude box and 40 000 Hz in the frequency box. Click On. Click Signal Generator. 4. On the graph, click by the vertical axis and select Output Voltage Ch 01 (V). Adjust the scale. In the toolbar at the top, click on (Add new y axis to scope display.) Click by the vertical axis which appears on the right and select Voltage, Ch A. Adjust its scale too. There are now two sine curves on the graph: One is the signal driving the “speaker,” the other is the signal from the “microphone.” Just ignore the speaker’s. 5. Near the top left of the graph, click stabilize the display. (Activate and Control Scope Trigger). This should 6. Notice that now, if you move the receiver, you can see the waves go by on the computer. Measure the wavelength: a. Start with the source and receiver a few centimeters apart. (Standing waves form between them if they're too close.) Lay a ruler on the table with its end where the receiver is now. Be sure the ruler doesn't move after this. b. Move the receiver ten wavelengths, by counting the number of waves that go by on the computer. Measure the distance moved by the receiver. (Not the distance between crests on the screen. The graph shows you the wave's period, not its wavelength.) Make sure the receiver is always facing directly toward the source. c. Divide the length of ten waves by ten. (This is more accurate than measuring just one wavelength.) 10. Record the frequency from the signal generator. 11. From the wave's frequency and wavelength, calculate its speed. 12. If your result has a 10% uncertainty, does it agree with the accepted value? Please shut down the computer before you leave. PHY 122 Report on Experiment 9: Sound Waves PART ONE loud soft high pitch low pitch Typical voice (humming): T= f= Plastic flute: T= Calculate period from distance to first hole (distance = ______________ cm): PART TWO: Length of 10 waves = λ= f= v=


