Monitoring the Condition of Aspen in the Northern and Intermountain...
advertisement

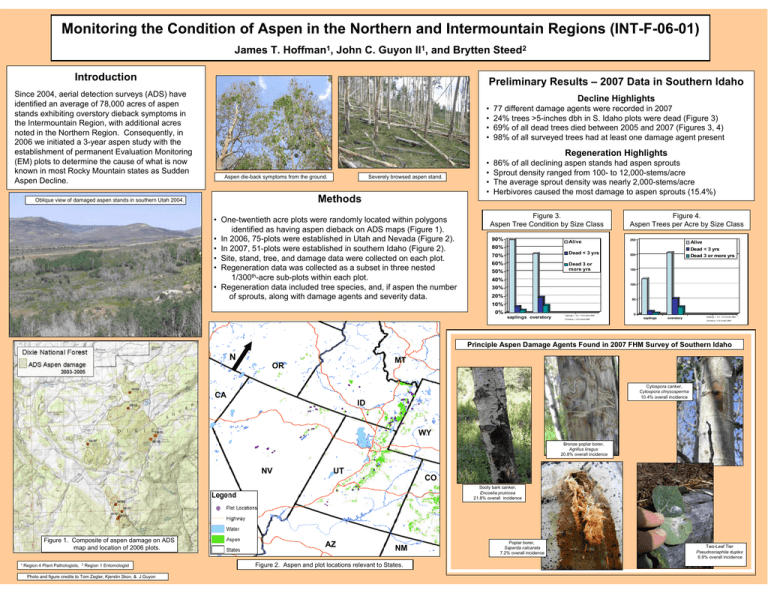
Monitoring the Condition of Aspen in the Northern and Intermountain Regions (INT-F-06-01) James T. Hoffman1, John C. Guyon II1, and Brytten Steed2 Introduction Since 2004, aerial detection surveys (ADS) have identified an average of 78,000 acres of aspen stands exhibiting overstory dieback symptoms in the Intermountain Region, with additional acres noted in the Northern Region. Consequently, in 2006 we initiated a 3-year aspen study with the establishment of permanent Evaluation Monitoring (EM) plots to determine the cause of what is now known in most Rocky Mountain states as Sudden Aspen Decline. Preliminary Results – 2007 Data in Southern Idaho Decline Highlights • • • • 77 different damage agents were recorded in 2007 24% trees >5-inches dbh in S. Idaho plots were dead (Figure 3) 69% of all dead trees died between 2005 and 2007 (Figures 3, 4) 98% of all surveyed trees had at least one damage agent present • • • • 86% of all declining aspen stands had aspen sprouts Sprout density ranged from 100- to 12,000-stems/acre The average sprout density was nearly 2,000-stems/acre Herbivores caused the most damage to aspen sprouts (15.4%) Regeneration Highlights Aspen die-back symptoms from the ground. Severely browsed aspen stand. Methods Oblique view of damaged aspen stands in southern Utah 2004. • One-twentieth acre plots were randomly located within polygons identified as having aspen dieback on ADS maps (Figure 1). • In 2006, 75-plots were established in Utah and Nevada (Figure 2). • In 2007, 51-plots were established in southern Idaho (Figure 2). • Site, stand, tree, and damage data were collected on each plot. • Regeneration data was collected as a subset in three nested 1/300th-acre sub-plots within each plot. • Regeneration data included tree species, and, if aspen the number of sprouts, along with damage agents and severity data. Figure 3. Aspen Tree Condition by Size Class 90% Alive Figure 4. Aspen Trees per Acre by Size Class 250 Alive Dead < 3 yrs Dead 3 or more yrs 80% 70% Dead < 3 yrs 200 60% Dead 3 or more yrs 150 50% 40% 100 30% 20% 50 10% 0% saplings overstory Saplings = 2.0 – 4.9 inches DBH Overstory = 4.9 inches DBH 0 saplings overstory Saplings = 2.0 – 4.9 inches DBH Overstory = 4.9 inches DBH Principle Aspen Damage Agents Found in 2007 FHM Survey of Southern Idaho N MT OR Cytospora canker, Cytospora chrysosperma 10.4% overall incidence CA ID WY Bronze poplar borer, Agrillus liragus 20.8% overall incidence NV UT CO Sooty bark canker, Encoelia pruinosa 21.8% overall incidence Figure 1. Composite of aspen damage on ADS map and location of 2006 plots. 1 Region 4 Plant Pathologists, 2 Region 1 Entomologist Photo and figure credits to Tom Zegler, Kjerstin Skov, & J.Guyon AZ NM Figure 2. Aspen and plot locations relevant to States. Poplar borer, Saperda calcarata 7.2% overall incidence Two-Leaf Tier Pseudosciaphila duplex 6.9% overall incidence


