A Marketing Perspective Our Food System 9/5/2008
advertisement
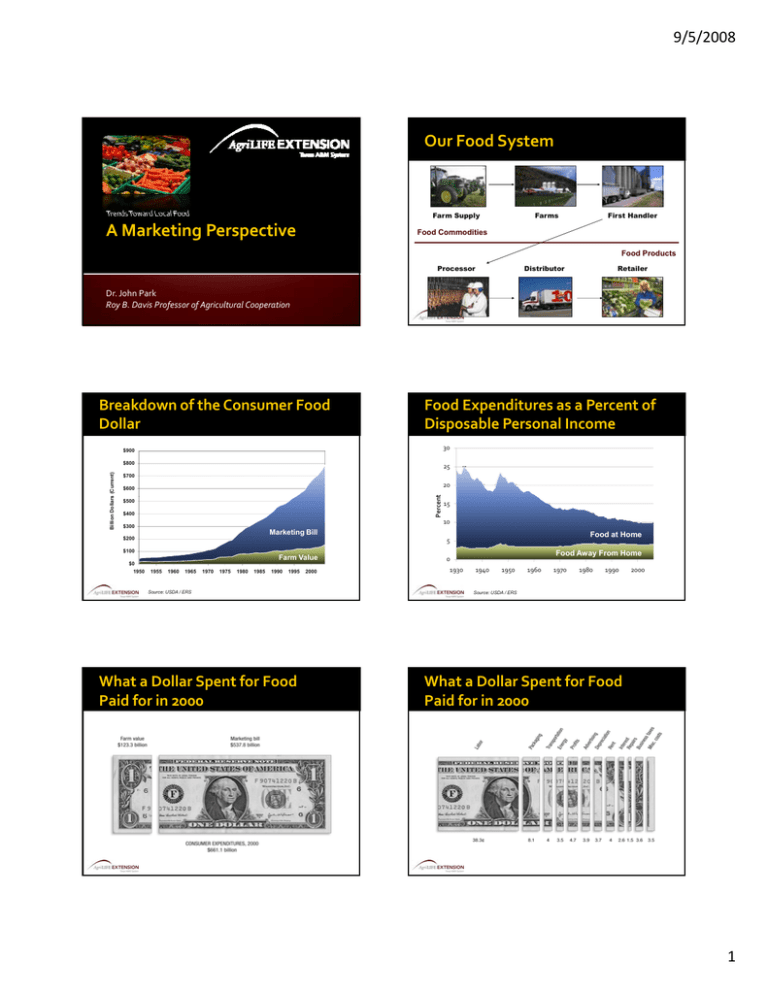
9/5/2008 Our Food System Farm Supply Trends Toward Local Food A Marketing Perspective Farms First Handler Food Commodities Food Products Processor Distributor Retailer Dr. John Park Roy B. Davis Professor of Agricultural Cooperation Breakdown of the Consumer Food Dollar Food Expenditures as a Percent of Disposable Personal Income 30 $900 25 $700 20 $600 Percentt Billion Dollars s (Current) $800 $500 $400 15 10 $300 Marketing Bill $200 Food at Home 5 $100 Farm Value $0 1950 1955 1960 1965 1970 1975 1980 1985 1990 1995 Source: USDA / ERS What a Dollar Spent for Food Paid for in 2000 2000 Food Away From Home 0 1930 1940 1950 1960 1970 1980 1990 2000 Source: USDA / ERS What a Dollar Spent for Food Paid for in 2000 1 9/5/2008 Food Industry Stats, 2006 Food System Impacts $511 Costs and Benefits to Society $500 925 12.5 Restaurants Supermarkets 34 Sales (billions) Locations (thousands) 3.4 Employees (millions) Source: NRA, FMI Societal Impacts POSITIVE Obesity Rates NEGATIVE Low cost food Greater wealth to dedicate to other uses Greater convenience Greater variety Year‐round availability Certain and reliable food supply Industrialized food production Reliance on fossil fuels Less variety Increased rate of obesity Increased rates of Type II Diabetes Obesity Trends Among U.S. Adults Obesity Trends Among U.S. Adults BRFSS, 1985 BRFSS, 1986 (*BMI ≥30, or ~ 30 lbs overweight for 5’ 4” person) No Data <10% 10%–14% Source: Behavior Risk Factor Surveillance System, CDC (*BMI ≥30, or ~ 30 lbs overweight for 5’ 4” person) No Data <10% 10%–14% Source: Behavior Risk Factor Surveillance System, CDC 2 9/5/2008 Obesity Trends Among U.S. Adults Obesity Trends Among U.S. Adults BRFSS, 1987 BRFSS, 1988 (*BMI ≥30, or ~ 30 lbs overweight for 5’ 4” person) No Data <10% 10%–14% (*BMI ≥30, or ~ 30 lbs overweight for 5’ 4” person) No Data <10% Source: Behavior Risk Factor Surveillance System, CDC 10%–14% Source: Behavior Risk Factor Surveillance System, CDC Obesity Trends Among U.S. Adults Obesity Trends Among U.S. Adults BRFSS, 1989 BRFSS, 1990 (*BMI ≥30, or ~ 30 lbs overweight for 5’ 4” person) No Data <10% 10%–14% (*BMI ≥30, or ~ 30 lbs overweight for 5’ 4” person) No Data <10% Source: Behavior Risk Factor Surveillance System, CDC 10%–14% Source: Behavior Risk Factor Surveillance System, CDC Obesity Trends Among U.S. Adults Obesity Trends Among U.S. Adults BRFSS, 1991 BRFSS, 1992 (*BMI ≥30, or ~ 30 lbs overweight for 5’ 4” person) No Data <10% 10%–14% 15%–19% Source: Behavior Risk Factor Surveillance System, CDC (*BMI ≥30, or ~ 30 lbs overweight for 5’ 4” person) No Data <10% 10%–14% 15%–19% Source: Behavior Risk Factor Surveillance System, CDC 3 9/5/2008 Obesity Trends Among U.S. Adults Obesity Trends Among U.S. Adults BRFSS, 1993 BRFSS, 1994 (*BMI ≥30, or ~ 30 lbs overweight for 5’ 4” person) No Data <10% 10%–14% 15%–19% (*BMI ≥30, or ~ 30 lbs overweight for 5’ 4” person) No Data <10% Source: Behavior Risk Factor Surveillance System, CDC 10%–14% 15%–19% Source: Behavior Risk Factor Surveillance System, CDC Obesity Trends Among U.S. Adults Obesity Trends Among U.S. Adults BRFSS, 1995 BRFSS, 1996 (*BMI ≥30, or ~ 30 lbs overweight for 5’ 4” person) No Data <10% 10%–14% 15%–19% (*BMI ≥30, or ~ 30 lbs overweight for 5’ 4” person) No Data <10% Source: Behavior Risk Factor Surveillance System, CDC 10%–14% 15%–19% Source: Behavior Risk Factor Surveillance System, CDC Obesity Trends Among U.S. Adults Obesity Trends Among U.S. Adults BRFSS, 1997 BRFSS, 1998 (*BMI ≥30, or ~ 30 lbs overweight for 5’ 4” person) No Data <10% 10%–14% 15%–19% 20%–24% Source: Behavior Risk Factor Surveillance System, CDC (*BMI ≥30, or ~ 30 lbs overweight for 5’ 4” person) No Data <10% 10%–14% 15%–19% 20%–24% Source: Behavior Risk Factor Surveillance System, CDC 4 9/5/2008 Obesity Trends Among U.S. Adults Obesity Trends Among U.S. Adults BRFSS, 1999 BRFSS, 2000 (*BMI ≥30, or ~ 30 lbs overweight for 5’ 4” person) No Data <10% 10%–14% 15%–19% 20%–24% (*BMI ≥30, or ~ 30 lbs overweight for 5’ 4” person) No Data <10% Source: Behavior Risk Factor Surveillance System, CDC 10%–14% 15%–19% 20%–24% Source: Behavior Risk Factor Surveillance System, CDC Obesity Trends Among U.S. Adults Obesity Trends Among U.S. Adults BRFSS, 2001 BRFSS, 2002 (*BMI ≥30, or ~ 30 lbs overweight for 5’ 4” person) No Data <10% 10%–14% 15%–19% 20%–24% 25%–29% (*BMI ≥30, or ~ 30 lbs overweight for 5’ 4” person) No Data <10% Source: Behavior Risk Factor Surveillance System, CDC 10%–14% 15%–19% 20%–24% 25%–29% Source: Behavior Risk Factor Surveillance System, CDC Obesity Trends Among U.S. Adults Obesity Trends Among U.S. Adults BRFSS, 2003 BRFSS, 2004 (*BMI ≥30, or ~ 30 lbs overweight for 5’ 4” person) No Data <10% 10%–14% 15%–19% 20%–24% 25%–29% Source: Behavior Risk Factor Surveillance System, CDC (*BMI ≥30, or ~ 30 lbs overweight for 5’ 4” person) No Data <10% 10%–14% 15%–19% 20%–24% 25%–29% Source: Behavior Risk Factor Surveillance System, CDC 5 9/5/2008 Obesity Trends Among U.S. Adults BRFSS, 2005 Top Causes of Mortality in US, 2005 Heart disease: 652,091 Cancer: 559,312 Stroke (cerebrovascular diseases): 143,579 Chronic lower respiratory diseases: 130,933 h l d Accidents (unintentional injuries): 117,809 Diabetes: 75,119 (*BMI ≥30, or ~ 30 lbs overweight for 5’ 4” person) No Data <10% 10%–14% 15%–19% 20%–24% 25%–29% ≥30% Source: Behavior Risk Factor Surveillance System, CDC How did we get here? 2003 only about 10% of disposable income on food Population Families continue to feel the pressure of time with more dual‐income or single parent households d l l h h ld Convenience Demands on time have changed how we shop, what we eat, and how we cook Who do consumers rely on to help them eat healthy foods? Wealth US consumers are relatively wealthy, spending Source: National Center for Health Statistics, CDC Technology The fast pace of technology has not only impacted consumer behavior and expectations, but also changed what is possible for manufacturers 2004 Themselves 41% Manufacturers 16% Government 14% 16% 46% 25% 11% 9% All 5% 5% Food Stores 3% 4% Consumer Groups 0% 10% 20% 30% 40% 50% Source: Food Marketing Institute Consumer Conflict Government Action Dissatisfaction with consumption and result Help me get back in balance! Help me make better choices p Make the foods I love better Give me new options to improve my health Food Fads Legislation and Lawsuits Lifestyle Changes 6 9/5/2008 When consumers give up rights of choice: legislation or lawsuit? Super Size Me (2004) As a statement on the impacts of the modern food system, filmmaker Morgan Spurlock attempts to eat nothing but McDonald’s food for one month. Leading up to Local Food Local Food One Trend or Two? The Natural Food Movement Make what we have better Organic production practices Niche Farming Producers taking advantage of “niche” organic markets Pizza Farms and ag tourism Local Food Movement Community Supported Ag Farm to School programs “Slow Food” gardens Consumer Driven Food System High Quality, Own Brand Food Retailers Organics, i Natural Foods Locavores Not Fully Understood “In state” and “nearby” very similar to consumers 44 states with labeling programs Whole Foods Whole Foods’ foodshed foodshed within 250 miles Food Manufacturers Consumers Local Food Slow Food CSAs Consumer Cooperatives Socially motivated? Focused on distance to consumer Sustainability of resources, ecology Producers What is “local” anyway? Product focused? Freshness Anti‐corporate images 7 9/5/2008 Kraft Foods Reinvented? Retailers and Local Food Closest competitors to Farmers Markets or CSAs Very adept at merchandising Could enter the Local Food market as it ld h l d k matures Issues for retail Reliability of the source Seasonality Attracting the locavore 8

