Geographic Information System (GIS) Mapping of the Michigan Natural Storage Gypsum Mine
advertisement
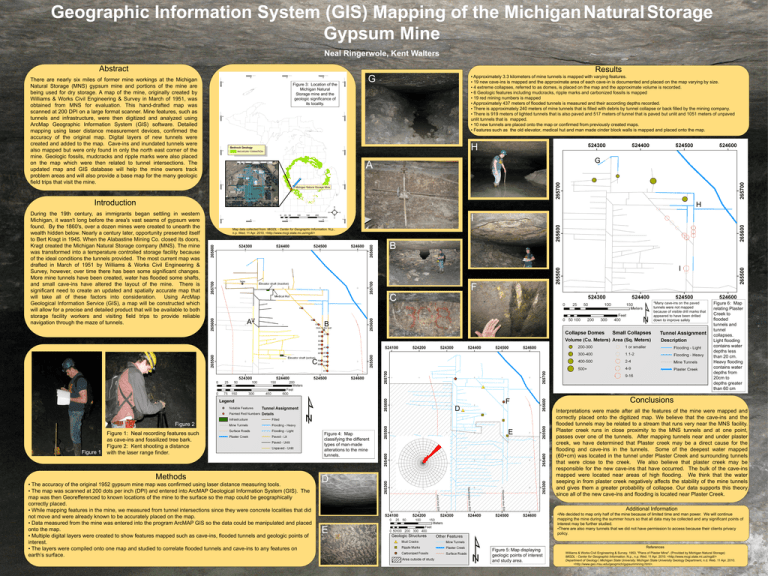
Geographic Information System (GIS) Mapping of the Michigan Natural Storage Gypsum Mine Neal Ringerwole, Kent Walters Abstract Results There are nearly six miles of former mine workings at the Michigan Natural Storage (MNS) gypsum mine and portions of the mine are being used for dry storage. A map of the mine, originally created by Williams & Works Civil Engineering & Survey in March of 1951, was obtained from MNS for evaluation. This hand-drafted map was scanned at 200 DPI on a large format scanner. Mine features, such as tunnels and infrastructure, were then digitized and analyzed using ArcMap Geographic Information System (GIS) software. Detailed mapping using laser distance measurement devices, confirmed the accuracy of the original map. Digital layers of new tunnels were created and added to the map. Cave-ins and inundated tunnels were also mapped but were only found in only the north east corner of the mine. Geologic fossils, mudcracks and ripple marks were also placed on the map which were then related to tunnel intersections. The updated map and GIS database will help the mine owners track problem areas and will also provide a base map for the many geologic field trips that visit the mine. Figure 3: Location of the Michigan Natural Storage mine and the geologic significance of its locality. • Approximately 3.3 kilometers of mine tunnels is mapped with varying features. • 19 new cave-ins is mapped and the approximate area of each cave-in is documented and placed on the map varying by size. • 4 extreme collapses, referred to as domes, is placed on the map and the approximate volume is recorded. • 6 Geologic features including mudcracks, ripple marks and carbonized fossils is mapped • 19 red mining numbers is mapped • Approximately 437 meters of flooded tunnels is measured and their according depths recorded. • There is approximately 240 meters of mine tunnels that is filled with debris by tunnel collapse or back filled by the mining company. • There is 919 meters of lighted tunnels that is also paved and 517 meters of tunnel that is paved but unlit and 1051 meters of unpaved unlit tunnels that is mapped. • 10 new tunnels are placed onto the map or confirmed from previously created maps. • Features such as the old elevator, medical hut and man made cinder block walls is mapped and placed onto the map. G H G A G A Figure Introduction H B During the 19th century, as immigrants began settling in western Michigan, it wasn't long before the area's vast seams of gypsum were found. By the 1860's, over a dozen mines were created to unearth the wealth hidden below. Nearly a century later, opportunity presented itself to Bert Kragt in 1945. When the Alabastine Mining Co. closed its doors, Kragt created the Michigan Natural Storage company (MNS). The mine was transformed into a temperature controlled storage facility because of the ideal conditions the tunnels provided. The most current map was drafted in March of 1951 by Williams & Works Civil Engineering & Survey, however, over time there has been some significant changes. More mine tunnels have been created, water has flooded some shafts, and small cave-ins have altered the layout of the mine. There is significant need to create an updated and spatially accurate map that will take all of these factors into consideration. Using ArcMap Geological Information Service (GIS), a map will be constructed which will allow for a precise and detailed product that will be available to both storage facility workers and visiting field trips to provide reliable navigation through the maze of tunnels. I Map data collected from: MiGDL - Center for Geographic Information. N.p., n.p. Wed. 11 Apr. 2010. <http://www.mcgi.state.mi.us/mgdl/> B CI F C AA *Many cave-ins on the paved tunnels were not mapped because of visible drill marks that appeared to have been drilled down to improve safety BB C C A A D F Figure 2 Figure 1 Figure 1: Neal recording features such as cave-ins and fossilized tree bark. Figure 2: Kent shooting a distance with the laser range finder. E Figure 4: Map classifying the different types of man-made alterations to the mine tunnels. 0 270 Methods • The accuracy of the original 1952 gypsum mine map was confirmed using laser distance measuring tools. • The map was scanned at 200 dots per inch (DPI) and entered into ArcMAP Geological Information System (GIS). The map was then Georefferenced to known locations of the mine to the surface so the map could be geographically correctly placed. • While mapping features in the mine, we measured from tunnel intersections since they were concrete localities that did not move and were already known to be accurately placed on the map. • Data measured from the mine was entered into the program ArcMAP GIS so the data could be manipulated and placed onto the map. • Multiple digital layers were created to show features mapped such as cave-ins, flooded tunnels and geologic points of interest. • The layers were compiled onto one map and studied to correlate flooded tunnels and cave-ins to any features on earth’s surface. 90 D 180 Figure 6: Map relating Plaster Creek to flooded tunnels and tunnel collapses. Light flooding contains water depths less than 20 cm. Heavy flooding contains water depths from 20cm to depths greater than 60 cm Conclusions Interpretations were made after all the features of the mine were mapped and correctly placed onto the digitized map. We believe that the cave-ins and the flooded tunnels may be related to a stream that runs very near the MNS facility. Plaster creek runs in close proximity to the MNS tunnels and at one point, passes over one of the tunnels. After mapping tunnels near and under plaster creek, we have determined that Plaster creek may be a direct cause for the flooding and cave-ins in the tunnels. Some of the deepest water mapped (60+cm) was located in the tunnel under Plaster Creek and surrounding tunnels that were close to the creek. We also believe that plaster creek may be responsible for the new cave-ins that have occurred. The bulk of the cave-ins mapped were located near areas of high flooding. We think that the water seeping in from plaster creek negatively affects the stability of the mine tunnels and gives them a greater probability of collapse. Our data supports this theory since all of the new cave-ins and flooding is located near Plaster Creek. Additional Information •We decided to map only half of the mine because of limited time and man power. We will continue mapping the mine during the summer hours so that all data may be collected and any significant points of interest may be further studied. •There are also many tunnels that we did not have permission to access because their clients privacy policy. E Figure 5: Map displaying geologic points of interest and study area. References Williams & Works Civil Engineering & Survey, 1953, "Plans of Plaster Mine". (Provided by Michigan Natural Storage) MiGDL - Center for Geographic Information. N.p., n.p. Wed. 11 Apr. 2010. <http://www.mcgi.state.mi.us/mgdl/> Department of Geology | Michigan State University. Michigan State University Geology Department, n.d. Web. 11 Apr. 2010. <http://www.geo.msu.edu/geogmich/gypsummining.html>.
