The Nation’s Report Card Reading 2009 Frequently Asked Questions
advertisement
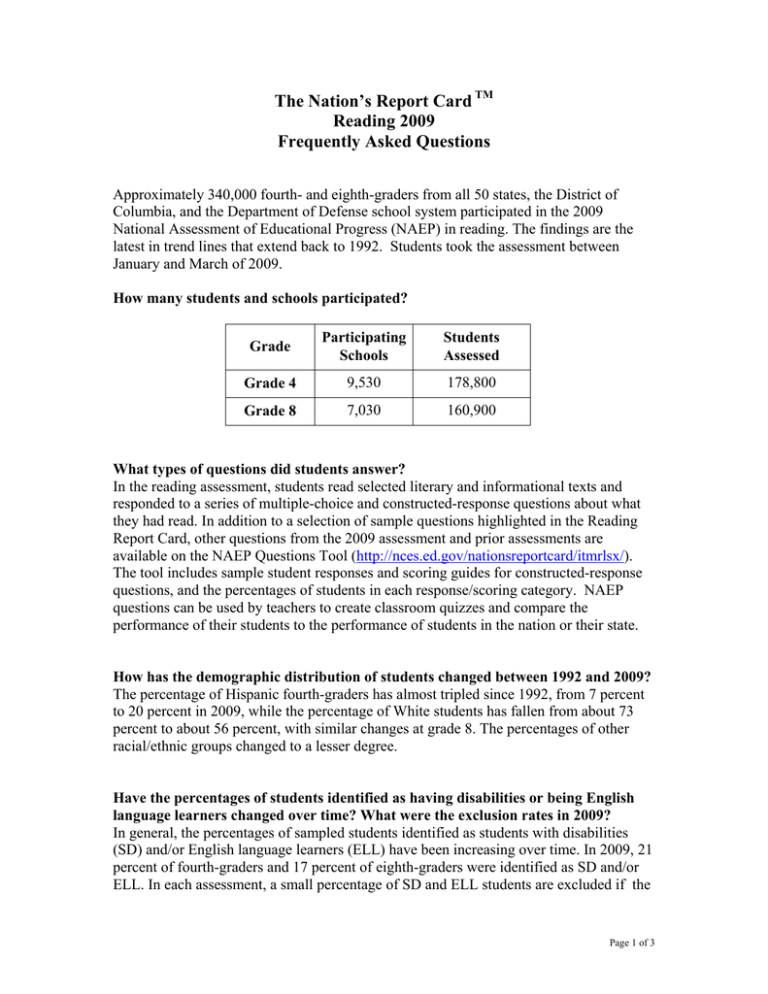
The Nation’s Report Card TM Reading 2009 Frequently Asked Questions Approximately 340,000 fourth- and eighth-graders from all 50 states, the District of Columbia, and the Department of Defense school system participated in the 2009 National Assessment of Educational Progress (NAEP) in reading. The findings are the latest in trend lines that extend back to 1992. Students took the assessment between January and March of 2009. How many students and schools participated? Grade Participating Schools Students Assessed Grade 4 9,530 178,800 Grade 8 7,030 160,900 What types of questions did students answer? In the reading assessment, students read selected literary and informational texts and responded to a series of multiple-choice and constructed-response questions about what they had read. In addition to a selection of sample questions highlighted in the Reading Report Card, other questions from the 2009 assessment and prior assessments are available on the NAEP Questions Tool (http://nces.ed.gov/nationsreportcard/itmrlsx/). The tool includes sample student responses and scoring guides for constructed-response questions, and the percentages of students in each response/scoring category. NAEP questions can be used by teachers to create classroom quizzes and compare the performance of their students to the performance of students in the nation or their state. How has the demographic distribution of students changed between 1992 and 2009? The percentage of Hispanic fourth-graders has almost tripled since 1992, from 7 percent to 20 percent in 2009, while the percentage of White students has fallen from about 73 percent to about 56 percent, with similar changes at grade 8. The percentages of other racial/ethnic groups changed to a lesser degree. Have the percentages of students identified as having disabilities or being English language learners changed over time? What were the exclusion rates in 2009? In general, the percentages of sampled students identified as students with disabilities (SD) and/or English language learners (ELL) have been increasing over time. In 2009, 21 percent of fourth-graders and 17 percent of eighth-graders were identified as SD and/or ELL. In each assessment, a small percentage of SD and ELL students are excluded if the Page 1 of 3 accommodations provided by the students’ individual education plans (IEP) and/or 504 plans are not permitted on NAEP and their schools determine that they cannot be meaningfully assessed on NAEP without these accommodations. Approximately 4 to 5 percent of SD and/or ELL students were excluded nationally. For more information on national and state-by-state accommodation and exclusion rates, see pages 44-51 of the report. What testing accommodations does NAEP offer? NAEP allows students with disabilities and English language learners to use most of the testing accommodations that they receive for state or district tests. Accommodations are adaptations to standard testing procedures that remove barriers to participation in assessments without changing what is being tested. Examples of such accommodations are extended time and small-group or one-on-one administration. NAEP does not allow reading passages to be read aloud to the student, as that accommodation would alter what is being tested (the student’s ability to read the printed word in English). For the same reason, NAEP does not allow translation of the reading assessment. What additional information is available on individual state performance? There are a variety of tools available on the NAEP website at http://nces.ed.gov/nationsreportcard to further explore the state results. The state profiles page provides data for each state and links to one-page, printable summaries of state performance (known as “snapshots”). The NAEP Data Explorer allows users to search for student results by race/ethnicity, gender, teacher experience and many of other variables for each state. The NAEP Questions Tool provides results for each state on all released NAEP questions in various subjects including mathematics. Trend data are also available for all 50 states, the District of Columbia, and the Department of Defense schools back to 2003, and for selected states back to the first state assessments in 1992 for grade 4 and 1998 for grade 8. How do the samples for TUDA contribute to state results? Eighteen large urban districts participated in the 2009 NAEP assessments as part of the NAEP Trial Urban District Assessment (TUDA). Larger samples of students from these districts participated in the assessment, contributing to both their state’s results, as well as results for the nation. For example, the results reported for students in Boston also contribute to the results reported for Massachusetts and to the results for the nation. The districts’ results are weighted so that their contribution to the state results reflects the actual proportion of students in the population. Results for the 18 urban districts (including the District of Columbia) that participated in the 2009 reading assessment will be released later this year. Page 2 of 3 How has the 2009 reading framework changed? Frameworks define the knowledge and skills to be tested on NAEP. In 2009, the National Assessment Governing Board developed a new framework for the reading assessment. The previous reading framework was used from 1992 until the most recent assessment in 2007. The new framework includes more emphasis on literary and informational texts, a new definition of reading processes, a new systematic assessment of vocabulary knowledge, and the addition of poetry to grade 4. Results from special analyses determined the 2009 reading assessment results could be compared with those from earlier assessment years. A summary of these special analyses and an overview of the differences between the previous framework and the 2009 framework are available on the Web at http://nces.ed.gov/nationsreportcard/reading/trend_study.asp. About the National Assessment of Educational Progress The National Assessment of Educational Progress (NAEP), first administered in 1969, is the largest nationally representative assessment of what the nation’s students know and can do in core subjects such as mathematics, reading, science, and writing. Teachers, principals, parents, policymakers, and researchers all use NAEP results to assess progress and develop ways to improve education in America. The results of NAEP are published as The Nation’s Report CardTM, and are available for the nation, states, and in some cases, urban districts. NAEP is administered by the National Center for Education Statistics (NCES), within the Institute of Education Sciences of the U.S. Department of Education For information on NAEP and the 2009 reading assessment, visit: http://nationsreportcard.gov. For additional resources, visit: • NAEP Data Explorer http://nces.ed.gov/nationsreportcard/naepdata • NAEP State Profiles http://nces.ed.gov/nationsreportcard/states • NAEP Questions Tool http://nces.ed.gov/nationsreportcard/itmrlsx • NAEP Frameworks http://www.nagb.org/ Page 3 of 3
