A Guide to Finding Data Using NAEP
advertisement
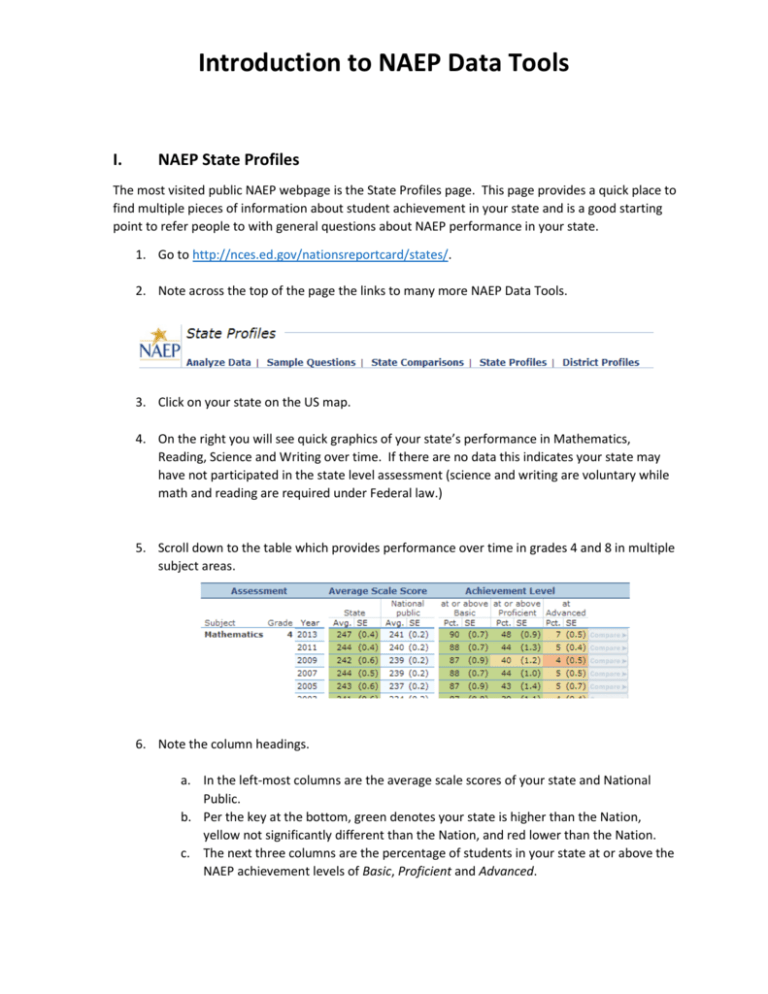
Introduction to NAEP Data Tools I. NAEP State Profiles The most visited public NAEP webpage is the State Profiles page. This page provides a quick place to find multiple pieces of information about student achievement in your state and is a good starting point to refer people to with general questions about NAEP performance in your state. 1. Go to http://nces.ed.gov/nationsreportcard/states/. 2. Note across the top of the page the links to many more NAEP Data Tools. 3. Click on your state on the US map. 4. On the right you will see quick graphics of your state’s performance in Mathematics, Reading, Science and Writing over time. If there are no data this indicates your state may have not participated in the state level assessment (science and writing are voluntary while math and reading are required under Federal law.) 5. Scroll down to the table which provides performance over time in grades 4 and 8 in multiple subject areas. 6. Note the column headings. a. In the left-most columns are the average scale scores of your state and National Public. b. Per the key at the bottom, green denotes your state is higher than the Nation, yellow not significantly different than the Nation, and red lower than the Nation. c. The next three columns are the percentage of students in your state at or above the NAEP achievement levels of Basic, Proficient and Advanced. 7. By clicking on any row within a subject area, it will take you to another page where you can look at how your state compares to other states as well as performance over time. 8. Return back to the State Profiles page (by clicking back and choosing your state again OR by choosing State Profiles on top of your current screen.) 9. Scroll down and on the right side find the section titled Snapshot Reports. These one page reports provide an efficient summary of performance in your state over time. Click on one to take a look and read over. These make nice handouts for conferences or management meetings. II. Nation’s Report Card Website With the release of the 2013 NAEP results in Reading and Mathematics, NAEP moved to all online reporting and stopped the production of print/pdf materials for the overall Nation’s Report Card. The outcome of this was to shift the focus of reporting results to an overall, interactive Nation’s Report Card website that serves as the main focus for release activities. 1. Go to http://www.nationsreportcard.gov 2. Note on this page there are lots of links to multiple resources and the top of the site will typically highlight the most recent release activities. We want to examine the most recent state release information for reading and mathematics. On the left choose the content area of Mathematics under Reports. Three lines down, click on “See the national/state results for grades 4 and 8.” [or alternatively use http://www.nationsreportcard.gov/reading_math_2013] 3. This page serves as the official release site for the 2013 NAEP Reading and Mathematics Results. Using the menu items on the left you can explore various aspects of the 2103 NAEP results. 4. Specifically, follow the menu item on the left that says How Are States Performing? Click through some of the options on the available pages to examine your state performance and related findings. 5. For future reference, look to the bottom of the page where it says “Access Complete Results”. a. Summary Data Tables – here you can find excel files that contain information about state sample sizes, participation rates and inclusion rates for SD and ELL students b. Custom Data Tables – basically a quick link to the NAEP Data Explorer (NDE) III. NAEP State Comparisons Tool The NAEP State Comparisons Tool was constructed to address the common request of rank ordering states by performance. This tool provides a quick avenue to examining performance in all states in a limited number of subgroups and subject areas. The largest asset of this tool is that it provides an appropriate comparison between states taking into account the variability of the estimates. 1. Go to http://nces.ed.gov/nationsreportcard/statecomparisons/. 2. Make the selections of: a. Grade 8 b. Mathematics c. NSLP d. Single year of 2013 e. Click Next Steps 3. We now have a list of all states and their performance for All Students and for each of the NSLP categories (Eligible and Not Eligible). Note every analysis comes with All Students. 4. Click on the button under All Students that says Scale Score. 5. This action rank ordered the list from greatest to least using the states’ average scale scores. On the far left you can see the ordering of the states. 6. Scroll down and note all states are being compared to the overall average scale score of National Public. The green arrows (>) denote states that scored higher than National Public, red arrows (<) denote states that scored lower than National Public, and yellow equal signs (=) denote states that had scores that were not significantly different than National Public. For example: a. Montana scored higher than National Public b. Utah did not score significantly different than National Public c. California scored lower than National Public 7. Let’s examine a single state. Click on Montana. You should note the coloring changes. This is because a different question is being asked. The comparison isn’t all states compared with National Public but all states compared with Montana. 8. What we find is that 5 states score higher than Montana, 15 states had scores that were not significantly different than Montana, and 31 states score lower than Montana. Hence, Montana could say that only 5 states had scores higher than theirs. IV. NAEP Data Explorer Go to http://nces.ed.gov/nationsreportcard/naepdata/ and select Main NDE. Research Question: Was the jurisdiction’s overall average scale score higher, lower or not different than the nation? 1. Select Criteria o Select Subject: Mathematics and Grade: Grade 8 o Select Measure: Composite scale (selected by default) o Select State: National Public and California (green arrow reveals states) o Select Year: 2013 2. Select Variables o Select Variable: All students [Major Reporting Groups > Student Factors > All students] 3. Edit Reports o No edits necessary. Average scale score is the default statistic so no choice needs to be made. Could Preview if desired. 4. Build Reports o Should see: National Public = 284 and California = 276 o Significance test 1. Select Between Jurisdictions 2. Provide name if desired 3. Select Table 4. Select Show Score Details 5. Select Jurisdiction: All Jurisdictions Click Done Interpretation: The average scale score for California was lower than the average scale score for National Public. Research Question: Did the jurisdiction’s percentage of National School Lunch Program eligible students scoring at or above Proficient increase, decrease or remain unchanged from 2003 to 2013? 1. Select Criteria o Select Subject: Mathematics and Grade: Grade 8 o Select Measure: Composite scale (default) o Select State: California o Select Year: 2003, 2013 2. Select Variables o Select Variable: National School Lunch Program eligibility [Major Reporting Groups > Student Factors > Natl School Lunch Program eligibility] 3. Edit Reports o Choose: Statistics Options o Select Options: Achievement levels – cumulative o Select At or Above Proficient o Click Done [In light blue banner] 4. Build Reports o Should see: Eligible = 2013 - 15%; 2003 - 9%; Not Eligible = 2013 - 45%; 2003 - 33% o Significance test 1. Select Across Years 2. Provide name if desired 3. Select Table 4. Select Show Score Details 5. Select Variable: Eligible Select Year: All Years (2003 and 2013) Select Statistic: At or Above Proficient Click Done Interpretation: The percentage of National School Lunch Program eligible students scoring at or above Proficient was greater in 2013 (15%) than the percentage in 2003 (9%). The percentage of students scoring at or above Proficient increased by 7% from 2003 to 2013 (due to rounding.) Questions or requests: Jason Nicholas jasonnicholas@westat.com 307-432-6868
