Modeling the 802.11 Distributed Coordination Function in Non-saturated Conditions Ken Duffy
advertisement

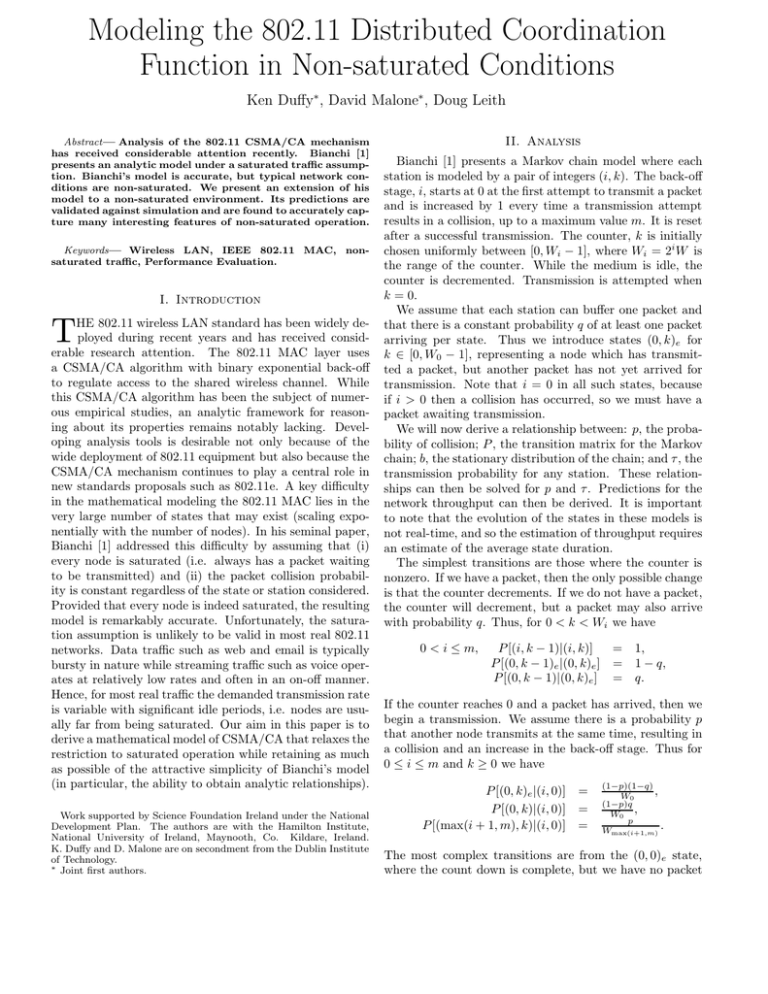
Modeling the 802.11 Distributed Coordination Function in Non-saturated Conditions Ken Duffy∗ , David Malone∗ , Doug Leith Abstract— Analysis of the 802.11 CSMA/CA mechanism has received considerable attention recently. Bianchi [1] presents an analytic model under a saturated traffic assumption. Bianchi’s model is accurate, but typical network conditions are non-saturated. We present an extension of his model to a non-saturated environment. Its predictions are validated against simulation and are found to accurately capture many interesting features of non-saturated operation. Keywords— Wireless LAN, IEEE 802.11 MAC, nonsaturated traffic, Performance Evaluation. I. Introduction T HE 802.11 wireless LAN standard has been widely deployed during recent years and has received considerable research attention. The 802.11 MAC layer uses a CSMA/CA algorithm with binary exponential back-off to regulate access to the shared wireless channel. While this CSMA/CA algorithm has been the subject of numerous empirical studies, an analytic framework for reasoning about its properties remains notably lacking. Developing analysis tools is desirable not only because of the wide deployment of 802.11 equipment but also because the CSMA/CA mechanism continues to play a central role in new standards proposals such as 802.11e. A key difficulty in the mathematical modeling the 802.11 MAC lies in the very large number of states that may exist (scaling exponentially with the number of nodes). In his seminal paper, Bianchi [1] addressed this difficulty by assuming that (i) every node is saturated (i.e. always has a packet waiting to be transmitted) and (ii) the packet collision probability is constant regardless of the state or station considered. Provided that every node is indeed saturated, the resulting model is remarkably accurate. Unfortunately, the saturation assumption is unlikely to be valid in most real 802.11 networks. Data traffic such as web and email is typically bursty in nature while streaming traffic such as voice operates at relatively low rates and often in an on-off manner. Hence, for most real traffic the demanded transmission rate is variable with significant idle periods, i.e. nodes are usually far from being saturated. Our aim in this paper is to derive a mathematical model of CSMA/CA that relaxes the restriction to saturated operation while retaining as much as possible of the attractive simplicity of Bianchi’s model (in particular, the ability to obtain analytic relationships). Work supported by Science Foundation Ireland under the National Development Plan. The authors are with the Hamilton Institute, National University of Ireland, Maynooth, Co. Kildare, Ireland. K. Duffy and D. Malone are on secondment from the Dublin Institute of Technology. ∗ Joint first authors. II. Analysis Bianchi [1] presents a Markov chain model where each station is modeled by a pair of integers (i, k). The back-off stage, i, starts at 0 at the first attempt to transmit a packet and is increased by 1 every time a transmission attempt results in a collision, up to a maximum value m. It is reset after a successful transmission. The counter, k is initially chosen uniformly between [0, Wi − 1], where Wi = 2i W is the range of the counter. While the medium is idle, the counter is decremented. Transmission is attempted when k = 0. We assume that each station can buffer one packet and that there is a constant probability q of at least one packet arriving per state. Thus we introduce states (0, k)e for k ∈ [0, W0 − 1], representing a node which has transmitted a packet, but another packet has not yet arrived for transmission. Note that i = 0 in all such states, because if i > 0 then a collision has occurred, so we must have a packet awaiting transmission. We will now derive a relationship between: p, the probability of collision; P , the transition matrix for the Markov chain; b, the stationary distribution of the chain; and τ , the transmission probability for any station. These relationships can then be solved for p and τ . Predictions for the network throughput can then be derived. It is important to note that the evolution of the states in these models is not real-time, and so the estimation of throughput requires an estimate of the average state duration. The simplest transitions are those where the counter is nonzero. If we have a packet, then the only possible change is that the counter decrements. If we do not have a packet, the counter will decrement, but a packet may also arrive with probability q. Thus, for 0 < k < Wi we have 0 < i ≤ m, P [(i, k − 1)|(i, k)] = P [(0, k − 1)e |(0, k)e ] = P [(0, k − 1)|(0, k)e ] = 1, 1 − q, q. If the counter reaches 0 and a packet has arrived, then we begin a transmission. We assume there is a probability p that another node transmits at the same time, resulting in a collision and an increase in the back-off stage. Thus for 0 ≤ i ≤ m and k ≥ 0 we have P [(0, k)e |(i, 0)] = P [(0, k)|(i, 0)] = P [(max(i + 1, m), k)|(i, 0)] = (1−p)(1−q) , W0 (1−p)q W0 , p Wmax(i+1,m) . The most complex transitions are from the (0, 0)e state, where the count down is complete, but we have no packet to send. If no packet arrives, we stay in this state. If a packet arrives, the change of state depends on the current state of the medium: if the medium is idle we may begin a transmission, which may result in a successful transmission or a collision; if the medium is busy, the 802.11 MAC begins another stage-0 back-off. This gives k > 0, P [(0, k)e |(0, 0)e ] = k ≥ 0, P [(1, k)|(0, 0)e ] = k ≥ 0, P [(0, k)|(0, 0)e ] = q(1−τ )n−1 (1−p) , W0 q(1−τ )n−1 (1−p) , W0 q(1−τ )n−1 p , W1 q(1−(1−τ )n−1 ) . W0 1−q+ Note that we have used (1 − τ )n−1 as the probability that the medium is idle, where τ is the probability that a node is transmitting. As noted by Bianchi, 1 − p = (1 − τ )n−1 , thus our transition probabilities only depend on p and q. Solving for the stationary distribution, b, of this Markov chain yields (after lengthy algebra) 31 5 E σ 407us 20us Ts Tc 986us 986us TABLE I Parameters values for model and simulation. 0.4 0.35 normalised throughput P [(0, 0)e |(0, 0)e ] = W0 m 0.3 0.25 8 stations (sim) 8 stations (model) 6 stations (sim) 6 stations (model) 4 stations (sim) 4 stations (model) 2 stations (sim) 2 stations (model) 0.2 0.15 0 0.2 0.4 0.6 0.8 1 1.2 1.4 1.6 normalised total offered load 2 q W0 (W0 + 1) 1/b(0,0)e = (1 − q) + 2(1 − (1 − q)W0 ) q(W0 +1) q2 W0 + 2(1−q) 1−(1−q)W0 + p(1 − q) − q(1 − p)2 pq2 W0 2 − (1 − p) + 2(1−q)(1−p) W 1−(1−q) 0 m−1 +1 2W0 1−p−p(2p) 1−2p (1) Fig. 1. Throughput as the traffic arrival rate is varied for small numbers of nodes. For throughput rates below those shown there is agreement between the model and simulation. 0.4 and = = i=0 b(i,0)+ b(0,0)e q(1 − p) q2 W0 b(0,0)e 1−q (1−p)(1−(1−q)W0 ) − (1 − p) . (2) For given values of q, W0 , n and m we may solve the relationship (2) against 1 − p = (1 − τ )n−1 to determine the corresponding values of p and τ . In the limit q → 1, our model yields the same value for τ and p as Bianchi’s saturated model, as expected. The expression for throughput is the same as in [1], S= Ps Ptr E , (1 − Ptr )σ + Ptr Ps Ts + Ptr (1 − Ps )Tc where Ptr = 1 − (1 − τ )n , Ps = nτ (1 − τ )n−1 /Ptr , E is the time spent transmitting payload data, σ is the time for the counter to decrement, Ts is the time for a successful transmission and Tc is the time for a collision. Note that the denominator of this fraction is the expected duration a state in the Markov chain in real-time. III. Validation The model was verified against the ns2 based 802.11 simulator produced by TU-Berlin [2]. The MAC parameter values (corresponding to 802.11b) and packet sizes used are shown in Table I. Varying numbers of stations with a small buffer were simulated. In the first set of simulations, the arrivals at each station is Poisson traffic. Figure 1 and Figure 2 show predicted and simulated throughput as the arrival rate is varied and as the number of wireless nodes is varied (note that arrival rates are 0.3 0.25 0.2 16 stations (sim) 16 stations (model) 20 stations (sim) 20 stations (model) 24 stations (sim) 24 stations (model) 0.15 0 0.2 0.4 0.6 0.8 1 1.2 1.4 1.6 normalised total offered load Fig. 2. Throughput as the traffic arrival rate is varied for larger numbers of nodes. For throughput rates below those shown there is agreement between the model and simulation. 0.25 8 stations (sim) 8 stations (model) 6 stations (sim) 6 stations (model) 4 stations (sim) 4 stations (model) 2 stations (sim) 2 stations (model) 0.2 collision probability τ normalised throughput 0.35 Pm 0.15 0.1 0.05 0 0 0.2 0.4 0.6 0.8 1 1.2 1.4 1.6 normalised total offered load Fig. 3. Collision probability as the traffic arrival rate is varied for small numbers of nodes. merical changes, these changes are not significant. Two important assumptions of the model are constant probability of arrival per state and small interface buffers. The accuracy of the model predictions for a range of traffic types, as noted previously, suggests there is a useful robustness with respect to the first assumption. We have found that the model predictions are, however, more sensitive to the presence of large interface queues. It is possible to introduce extra states to model longer queues, and also to allow variable packet arrival probabilities per state. Owing to space restrictions this is beyond the scope of this paper. 0.12 0.11 0.1 normalised throughput 0.09 0.08 0.07 0.06 0.05 0.04 0.03 0.02 sim model 0.01 0 5 10 15 20 25 30 35 40 number of node pairs Fig. 4. Throughput for various numbers of node-pairs sending 64kbps on-off traffic streams. normalized by the physical data rate of 11Mbs). For completeness, the collision probabilities corresponding to Figure 1 are also shown in Figure 3 (similar accuracy is obtained for the conditions used in Figure 2). It can be seen that the model accurately captures important features of the CSMA/CA behavior. In particular, • the linear relationship (with slope 1) between throughput and offered load under low loads. • the limiting behavior of throughput at high offered loads (corresponding to saturation). • the complex transition between under-loaded and saturated regimes is accurately captured. For small numbers of nodes, we see that the saturation throughput is the maximum throughput. For larger numbers of nodes, the throughput falls as we approach saturation and the maximum throughput is achieved before saturation. Moreover, the offered load at which this peak occurs is relatively insensitive to the number of nodes. In the foregoing plots, packets arrivals are Poisson, yielding independent arrivals at a specified mean rate. However, we have found that similar results hold for a range of traffic types. To illustrate this, we briefly present results for simulated voice traffic with silence suppression. Following [3], we generate a 64kbs on-off traffic stream with on and off periods exponentially distributed with mean 1.5s (subject to the suggested minimum of 240ms). Traffic is between pairs of nodes. To account for the two-way correlated nature of voice conversations, the on/off periods of one node correspond to the off/on periods of an other. We apply our model to node-pairs when making predictions. Predicted and simulated throughput versus the number of node-pairs is shown in Figure 4, where it can be seen that our model is remarkably accurate. V. Related Work There are alternative approaches to non-saturated modeling, though each has their own drawbacks. In [4] a modification of [1] is considered where a probability of not transmitting is introduced that represents a station having no data to send. The model is not preditive as this probability is not known as a function of the load, but must be estimated from simulation. In [5] idle states are added after packet transmission to represent bursty arrivals in a simplistic way that does not account for postbackoff. In [6] a model where states are of fixed real-time length is introduced, but does not capture the key feature of a presaturation throughput peak. In [7] a model incorporating postbackoff is presented, but not solved explicitly. In [8] a non-Markov model is developed, but uses assumptions based on the saturated case that seem unlikely to always hold, for example at low loads. VI. Conclusion This paper presents a model of the 802.11 MAC layer in non-saturated conditions. The model is analytically tractable yet remarkably powerful. The model is found to be in quantitative and qualitative agreement with detailed simulations, yielding accurate predictions of throughput and collision probability. It also captures many important features of non-saturated operation for the first time (e.g. throughput may be significantly higher in non-saturated operation than when saturated). The model is accurate for a range of traffic types and this is illustrated with reference to voice calls (to the authors knowledge this is the first demonstration of an analytic model of voice calls in 802.11). The model is interesting not only because of the wide deployment of 802.11 equipment and the prevalence of non-saturated operation in real wireless networks but also because the CSMA/CA mechanism continues to play a central role in new standards proposals such as 802.11e [9] currently under development. IV. Considerations References It is easy to consider small variations on this model, such as disallowing packet arrival immediately after transmission, ignoring carrier sense in state (0, 0)e , or by limiting the number of retransmission attempts at the maximum back-off stage. We have investigated a number of these possibilities and found that while they result in small nu- [1] G. Bianchi, “Performance analysis of ieee 802.11 distributed coordination function,” IEEE Journal on Selected Areas in Communications, vol. 18, no. 3, pp. 535–547, March 2000. [2] S. Wiethölter and C. Hoene, “Design and verification of an IEEE 802.11e EDCF simulation model in ns-2.26,” Tech. Rep. TKN03-019, Technische Universität Berlin, November 2003. [3] A. P. Markopoulou, F. A. Tobagi, and M. J. Karam, “Assessing the quality of voice communications over internet backbones,” [4] [5] [6] [7] [8] [9] IEEE Transactions on Networking, vol. 11, no. 5, pp. 747–760, October 2003. Gahng-Seop Ahn, A. T. Campbell, A. Veres, and Li-Hsiang Sun, “Supporting service differentiation for real-time and best-effort traffic in stateless wireless ad hoc networks (swan),” IEEE Transactions on Mobile Computing, vol. 1, no. 3, pp. 192–207, 2002. M. Ergen and P. Varaiya, “Throughput analysis and admission control in IEEE 802.11a,” ACM-Kluwer MONET Special Issue on WLAN Optimization at the MAC and Ne twork Levels, 2004. A. N. Zaki and M. T. El-Hadidi, “Throughput analysis of ieee 802.11 dcf under finite load traffic,” in First International Symposium on Control, Communications and Signal Processing, 2004, pp. 535–538. G. R. Cantieni, Qiang Ni, C. Barakat, and T. Turletti, “Performance analysis under finite load and improvements for multirate 802.11,” to appear in Computer Communications, 2005. O. Tickoo and B. Sikdar, “A queueing model for finite load IEEE 802.11 random access,” in IEEE International Conference on Communications, June 2004, vol. 1, pp. 175 – 179. IEEE, Wirless LAN Medium Access Control (MAC) and Physical Layer (PHY) Specifications: Medium Access Control (MAC) enhancements for Quality of Service (QoS), IEEE std 802.11e-draft edition.


