Determination of Body Fat Using Imaging Techniques
advertisement
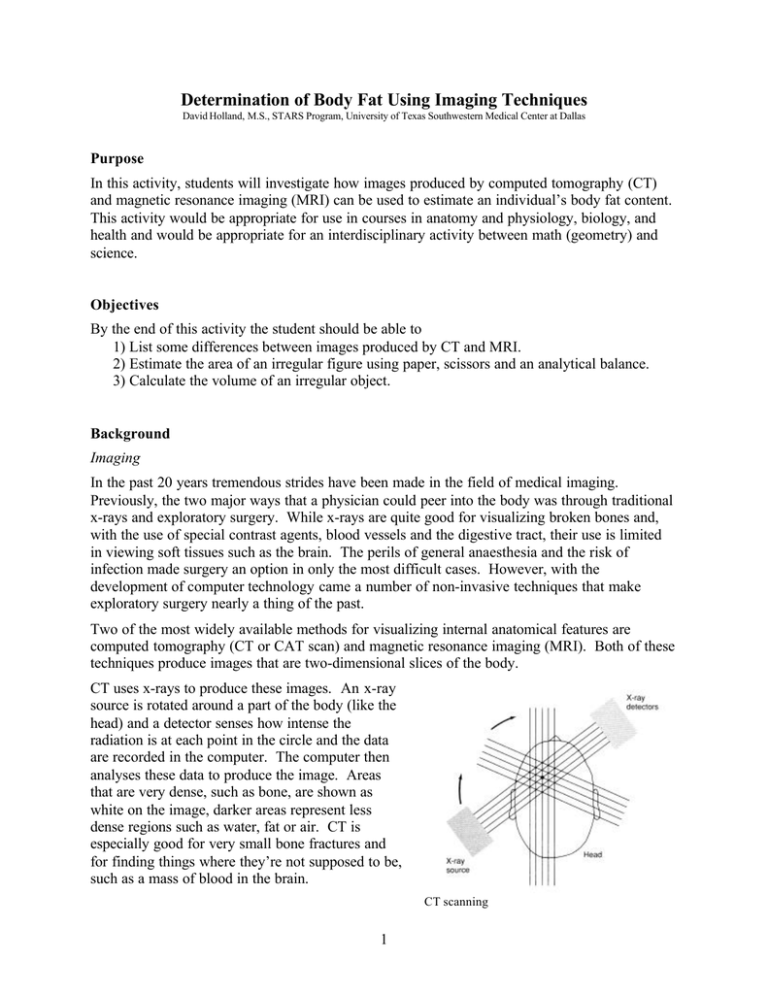
Determination of Body Fat Using Imaging Techniques David Holland, M.S., STARS Program, University of Texas Southwestern Medical Center at Dallas Purpose In this activity, students will investigate how images produced by computed tomography (CT) and magnetic resonance imaging (MRI) can be used to estimate an individual’s body fat content. This activity would be appropriate for use in courses in anatomy and physiology, biology, and health and would be appropriate for an interdisciplinary activity between math (geometry) and science. Objectives By the end of this activity the student should be able to 1) List some differences between images produced by CT and MRI. 2) Estimate the area of an irregular figure using paper, scissors and an analytical balance. 3) Calculate the volume of an irregular object. Background Imaging In the past 20 years tremendous strides have been made in the field of medical imaging. Previously, the two major ways that a physician could peer into the body was through traditional x-rays and exploratory surgery. While x-rays are quite good for visualizing broken bones and, with the use of special contrast agents, blood vessels and the digestive tract, their use is limited in viewing soft tissues such as the brain. The perils of general anaesthesia and the risk of infection made surgery an option in only the most difficult cases. However, with the development of computer technology came a number of non-invasive techniques that make exploratory surgery nearly a thing of the past. Two of the most widely available methods for visualizing internal anatomical features are computed tomography (CT or CAT scan) and magnetic resonance imaging (MRI). Both of these techniques produce images that are two-dimensional slices of the body. CT uses x-rays to produce these images. An x-ray source is rotated around a part of the body (like the head) and a detector senses how intense the radiation is at each point in the circle and the data are recorded in the computer. The computer then analyses these data to produce the image. Areas that are very dense, such as bone, are shown as white on the image, darker areas represent less dense regions such as water, fat or air. CT is especially good for very small bone fractures and for finding things where they’re not supposed to be, such as a mass of blood in the brain. CT scanning 1 Exploded view of MRI apparatus. MRI uses very large and powerful magnets and radio waves to form images. In a very strong magnetic field the protons in the molecules of the body will become aligned in the same direction. When hit with a pulse of radio waves the protons will momentarily become unaligned, but then will instantaneously fall back into alignment. When they do, they release a small amount of radio waves themselves. Detectors in the MRI unit will sense these tiny pulses of radio waves and computers reassemble this information into images. Instead of mainly detecting density differences as in CT, MRI is sensitive to differences in chemical content, usually water. So two tissues that have about the same density, but slightly different water content can be seen as different in MRI, but not with CT. Generally, in MRIs bone and fat (with little water content) will appear light in color and things high in water content will appear dark in color. A comparison of a CT scan (left) and an MRI (right) of similar portions of the brain. Note the greater detail and clarity in the soft tissues of the brain. Differences in white and gray matter are clearly evident in the MRI, but not in the CT. 2 With increasing computing power has come the ability to produce even more sophisticated images. By compiling a number of neighboring slices, three-dimensional images of individual structures within the body can be produced. For example, the heart is imaged from top to bottom into 1 mm slices, and then the outline of each slice is produced. By stacking all the outlines on top of one another and filling in the spaces between the slices, the computer forms a continuous surface and produces a 3-D image of the heart. The slices can also be used to determine the volume of the body part in question. This can be a very important diagnostic tool. For example, in some forms of heart disease, the ventricles become enlarged and are unable to pump blood properly. Knowing the actual volume of the ventricles can help a physician make an accurate diagnosis. Before discussing how to find the volume of an irregular object such as a ventricle, let’s review some basic geometry. Finding Volume You are familiar with finding the volume of regular objects such as prisms and cylinders. You have probably learned to “plug in” the dimensions into a formula to get the volume in cubic units. For example, if you have a box that is 10 x 10 x 20 cm you simply multiply length x width x height and get 2000 cm3 . A cylinder’s not much trickier, simply multiply π x radius 2 x height. You may not have thought about it before, but what you’re really doing is finding the area of one end of the cylinder (π r2 ) and multiplying it by the other dimension (h). Keeping this in mind, let’s see how we can find the volume of an irregular object. Suppose your teacher hands you a pear and asks you to find its volume. Once that you find that there’s no formula for the volume of a pear in your geometry book, you get mad and cut the pear up into 1 cm slices. However, you notice that each slice is, more or less, like a cylinder. You get the great idea to use the cylinder formula (which is in your book) to find the volume of each piece and then add all the volumes to find the total volume. Divide and conquer. Now, let’s go back to the heart problem. The heart ventricles aren’t exactly round, so your cylinder formula isn’t going to work. However, you don’t really have to rely on this formula to find the volume of each slice. Remember where we saw that if you knew the area of one end you could multiply by the height to find the volume? You could use that technique to determine the volume of each slice of ventricle and add them all up to find the total volume. The trick is to find the area of something irregular in shape. Finding the area of an irregular figure Now suppose your biology teacher asked you to find the surface area of a leaf. How would you do it? You could trace it on graph paper and then try to count the number of squares filled in. But you would have so many squares only partly filled in on the edges that not only would 3 it take a long time, but it would also lead to a lot of error. Here’s a trick you can use to solve the problem. Trace the leaf on a piece of paper and cut it out using scissors. Find the mass of the paper (not the leaf) using an analytical balance, let’s say it’s 0.15 g. Being fairly uniform in thickness, the mass of the paper should be proportional to its area. Now if the mass of 100 cm2 of paper is, say 0.25 g, we should be able to use proportions to solve for the area of the leaf as such: 100 cm2 x = 0.25 g 0.15 g Solving for x we get the area of the leaf. x = 100 cm2 • 0.15 g 0.25 g = 60 cm2 Finding volume of an irregular object Now we try to put all of this together. MRI and CT produce 2-dimensional slices of the body. On each slice one can determine the area of a irregularly-shaped structure by tracing it onto paper. The area of the irregular shape can be determined by finding its mass and solving a proportion determined with a piece of paper with a known area and mass (as above). If the thickness of each slice is known, then the volume can be determined by multiplying Volume = (area of the shape) x (thickness of the slice (height)). By adding the volumes of all of the individual slices the volume of the three-dimensional structure may be determined. (Whew!) Materials • MRI or CT images of serial abdominal sections • Pencil • Unlined paper • Metric ruler • Window, overhead projector, or light box • Scissors • Electronic balance • Calculator Procedure 1. Inspect the abdominal cross sections you have been given. They may be from a lean or obese individual. Find the subcutaneous fat in each image. In MRIs it will appear as a white band around the outside of the body, in CTs it will be black. This is the area that you will be tracing. 4 2. Using a window or overhead projector, lightly trace the outline of the fat deposit from each section onto a piece of paper. Make sure you label each outline with the slice number. 3. Cut out all of the traces and find the mass of each (to the nearest 0.01 g) using an electronic balance. Record these data in the data table. 4. Using the same type of paper, draw a 10 cm x 10 cm square in one corner and cut it out. Find its mass and record this in the data table. 5. Find the area of each outline using the following formula and record it in the table. Area = (100 cm2 • mass of cut out) / mass of square 6. Multiply the area of each cutout by the thickness of the slice (provided by your teacher). 7. Add the volume of all the slices to determine the total volume of subcutaneous fat in these sections. 8. Repeat this procedure for images from an obese or lean subject, if available. Data Subject 1 Section # Mass of Cutout Area of Cutout Volume of Slice Mass of 10 x 10 cm square ____________ Thickness of each slice __________ Total volume ___________ 5 Subject 2 Section # Mass of Cutout Area of Cutout Volume of Slice Mass of 10 x 10 cm square ____________ Thickness of each slice __________ Total volume ___________ Questions 1. Compare and contrast CT with MRI. 2. Give examples of when a physician may prefer CT over MRI and when they would prefer MRI over CT. 3. Using the pear example described above, what are some potential problems with using the “summed cylinders” technique? How could you change the sizes of cylinders used to help alleviate some of these problems? 4. Can you identify any other fat deposits in the images besides the ones directly under the skin? How would the presence of other fat deposits complicate the use of this procedure to estimate total body fat? 5. How do the subcutaneous fat deposits of obese individuals compare to those of lean indiviudals? References and Resources Fleckenstein, Peter and Jørgen Tranum-Jenson. (1993) Anatomy in Diagnostic Imaging. W.B. Saunders, Philadelphia. Thomas. E. Louise, et al. (1998) Magnetic resonance imaging of total body fat. Journal of Applied Physiology 85(5): 1778-1785. 6 rectus abdominus subcutaneous fat layer ascending colon abdominal aorta LIV 7 8 Guide to the sections included in this activity. Consecutive sections are 10 mm thick. 9
