Impact of Product on Logistics
advertisement
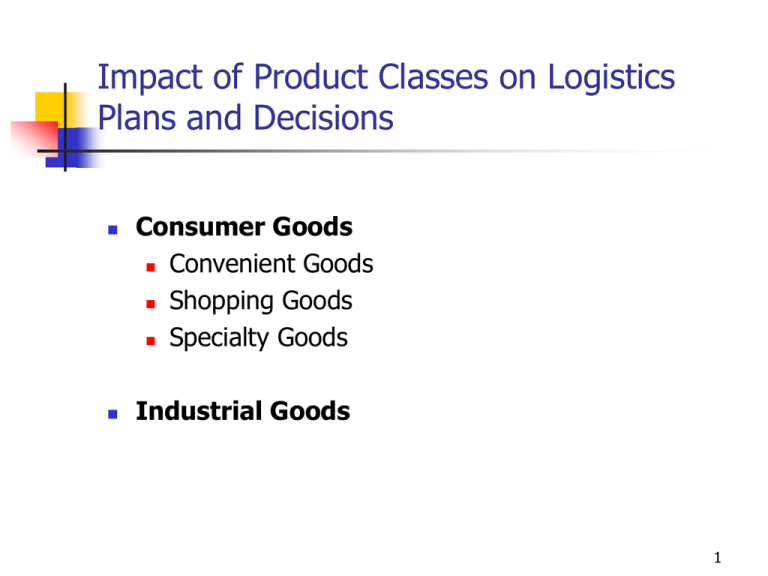
Impact of Product Classes on Logistics Plans and Decisions Consumer Goods Convenient Goods Shopping Goods Specialty Goods Industrial Goods 1 Product Characteristics Impacts on Planning Product life cycle 80-20 rule Individual characteristics: Weight-Bulk ratio (ration of weight to volume, density; e.g. cotton vs. steel) Value-Weight ratio (coal vs. jewelry) Substitutability (customer’s reaction when not in stock) Risk characteristics (perishability, flammability, ease of being stolen) 2 Product Life Cycle Sales Volume Intro ducti on Growth Maturity Declin e Time 3 80-20 Rule and ABC Classification 4 Product Number Product Rank by Sales Monthly Sales (1000 $) Cumulative Cumulative Product Percentage Percen tage Classific of Total of Total ation Sales Items %36,2 %7,1 A D-204 1 5056 D-212 2 3424 60,7 14,3 A D-185-0 3 1052 68,3 21,4 B D-191 4 893 74,6 28,6 B D-192 5 843 80,7 35,7 B D-193 6 727 85,9 42,6 B D-179-0 7 451 89,1 50 B D-195 8 412 91,9 57,1 C D-196 9 214 93,6 64,3 C D-186-0 10 205 95,1 71,4 C D-198-0 11 188 96,4 78,6 C D-199 12 172 97,6 85,7 C D-200 13 170 98,7 92,9 C D-205 14 159 100 100 C $13966 5 The 80-20 curve with an Arbitrary Product Classification Total Sales(%) A B 20 C 50 Total Items(%) 6 ABC Analysis Divides on-hand inventory into 3 classes Basis is usually annual $ volume A class, B class, C class $ volume = Annual demand x Unit cost Policies based on ABC analysis A items receives wide geographic distribution through many warehouses, with high levels of stock availability Give tighter physical control of A items Forecast A items more carefully C items might be distributed from a single, central stocking point(e.g. plant), with lower total stocking levels than for the A items B items would have an intermediate distribution strategy where few regional warehouses are used Transparency Masters to accompany Operations Management, 5E (Heizer & Render) 12-13 © 1998 by Prentice Hall, Inc. A Simon & Schuster Company Upper Saddle River, N.J. 07458 7 Inventory Value of the Products in a Warehouse 80-20 rule and ABC analysis can be used as the basis of grouping the products in a warehouse y= (1+A)x A+X where, Y= Fraction of cumulative sales X= Fraction of items A: constant to be determined If the relation between X and Y is already known: A= X(1-Y) (Y-X) 8 Product Rank Cumulative Item Proportion (X) Cumulative Sales (Y) Projected Item Sales Turnover Ratio D-204 1 0,0909 $12068 12068 7:1 Average Inventory Value $1724 D-212 2 0,1818 16867 4798 7:1 685 D-185-0 3 0,2727 19444 2577 5:1 515 D-192 4 0,3636 21052 1608 5:1 322 D-193 5 0,4545 22151 1099 5:1 220 D-179-0 6 0,5454 22950 799 5:1 160 D-195 7 0,6363 23557 607 3:1 202 D-198-0 8 0,7272 24034 477 3:1 159 D-199 9 0,8181 24419 384 3:1 128 D-200 10 0,9090 24735 316 3:1 105 D-205 11 1,0000 25000 265 3:1 88 $25000 $4308 9 Product Characteristics Weight- Bulk Ratio Value-Weight Ratio Substitutability Risk Characteristics 10 Logist ics Cost as a percen tage of sales price Generalized Effect of Product Density on Logistics Cost Total Cost Transportaiton Cost Storage Cost Increasing Weight-bulk ratio 11 Generalized Effect of Value-weight Ratio on Logistics Cost Logistic s Cost as a percenta ge of sales price Total Cost Storage Cost Transportation cost Increasing value-weight ratio 12 Effect of Improved Transportation on Logistics Cost for a given level of substitutability Total cost Logistics cost as a percent of price Transport cost Lost Sale cost Storage Cost Improved transportation service 13 Effect of Average Inventory Level on Logistics Cost for a Given Level of Substitutability Total cost Logis tics cost as a percen tage of price Storage cost Transportation cost Lost Sale cost Average inventory level 14 Generalized Effect of Product Risk On Logistics Cost Costs Total Cost Transportation Cost Storage Cost Increasing Level of Risk of the Product 15
