fourth
advertisement
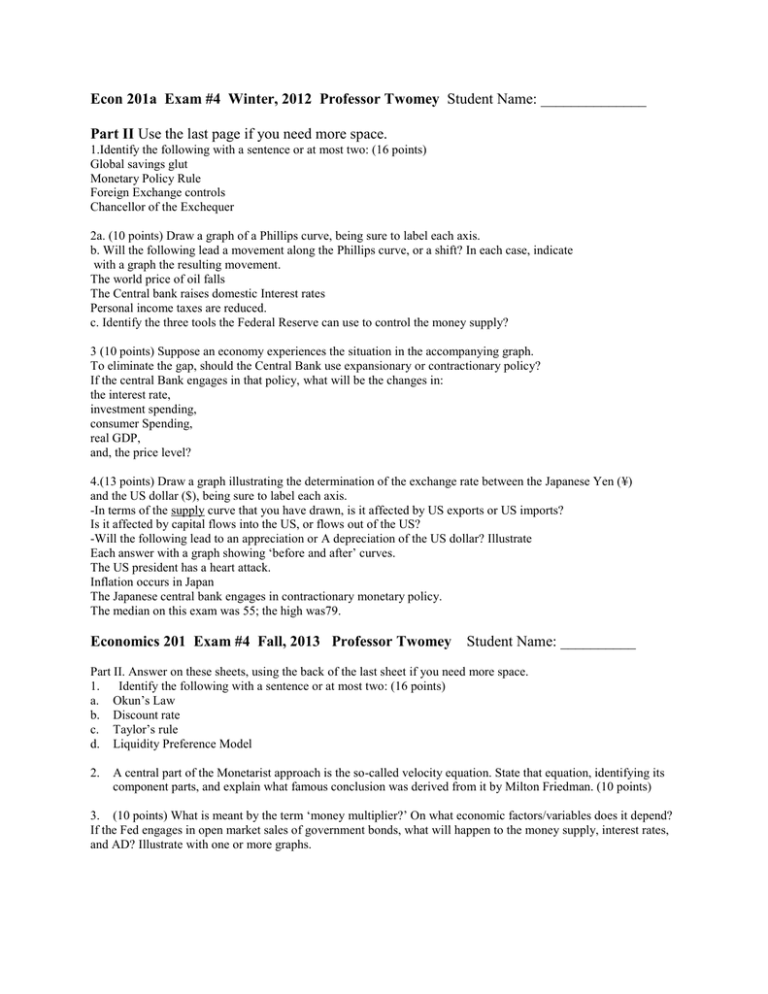
Econ 201a Exam #4 Winter, 2012 Professor Twomey Student Name: ______________ Part II Use the last page if you need more space. 1.Identify the following with a sentence or at most two: (16 points) Global savings glut Monetary Policy Rule Foreign Exchange controls Chancellor of the Exchequer 2a. (10 points) Draw a graph of a Phillips curve, being sure to label each axis. b. Will the following lead a movement along the Phillips curve, or a shift? In each case, indicate with a graph the resulting movement. The world price of oil falls The Central bank raises domestic Interest rates Personal income taxes are reduced. c. Identify the three tools the Federal Reserve can use to control the money supply? 3 (10 points) Suppose an economy experiences the situation in the accompanying graph. To eliminate the gap, should the Central Bank use expansionary or contractionary policy? If the central Bank engages in that policy, what will be the changes in: the interest rate, investment spending, consumer Spending, real GDP, and, the price level? 4.(13 points) Draw a graph illustrating the determination of the exchange rate between the Japanese Yen (¥) and the US dollar ($), being sure to label each axis. -In terms of the supply curve that you have drawn, is it affected by US exports or US imports? Is it affected by capital flows into the US, or flows out of the US? -Will the following lead to an appreciation or A depreciation of the US dollar? Illustrate Each answer with a graph showing ‘before and after’ curves. The US president has a heart attack. Inflation occurs in Japan The Japanese central bank engages in contractionary monetary policy. The median on this exam was 55; the high was79. Economics 201 Exam #4 Fall, 2013 Professor Twomey Student Name: __________ Part II. Answer on these sheets, using the back of the last sheet if you need more space. 1. Identify the following with a sentence or at most two: (16 points) a. Okun’s Law b. Discount rate c. Taylor’s rule d. Liquidity Preference Model 2. A central part of the Monetarist approach is the so-called velocity equation. State that equation, identifying its component parts, and explain what famous conclusion was derived from it by Milton Friedman. (10 points) 3. (10 points) What is meant by the term ‘money multiplier?’ On what economic factors/variables does it depend? If the Fed engages in open market sales of government bonds, what will happen to the money supply, interest rates, and AD? Illustrate with one or more graphs. 4. (13 points) Consider the market for US dollars in England, whose currency is the pound (£). Draw a graph of the determination of the equilibrium exchange rate between the doll and the pound, being sure to identify the exchange rate. On that graph, identify which curve is affected by US exports, and which curve is affected by capital flows from the US to England Will the following lead to an appreciation or a depreciation of the dollar? Explain briefly, and illustrate each answer with another graph. a) There is inflation in England. b) Their central bank the Bank of England, raises British interest rates. c. Political uncertainty is created due to a scandal involving the private life of the British Prime Minister. Econ 201 Fall, 2012 Exam #4 Prof. Twomey Student Name Part II. Use the back of the last sheet if you need more space. 1. a. b. c. d. 2. Identify the following with a sentence or at most two: (16 points) Money neutrality Bretton Woods Velocity of money Purchasing Power Parity (10 points) Last week, the Chair of the Federal Reserve, Ben Bernanke, announced a new policy position for the Fed: they will keep interest rates very low as long as unemployment is above 6.5%. Some media accounts also said that they will increase interest rates if inflation gets above two percent. Let’s place this in context of the proposed Taylor Rule. First of all, what is the Taylor Rule? Now, is what Bernanke proposed consistent with the Taylor Rule? Explain your answer. Another ‘rule’ that has been proposed is called inflation targeting. Explain that rule, and comment on its attractiveness compared to the plan that Bernanke just proposed. 3. (13 points) Draw a graph of the determination in Japan of the equilibrium exchange rate between the US Dollar and the Japanese Yen (¥). On that graph, after being sure to indicate the correct version of the exchange rate, identify which curve is affected by US imports, and which by capital flows from the US to Japan. How will the following affect the exchange rate of the US dollar? In each case, draw a graph and provide a short explanation. A) Inflation in the US B) US interest rates increase C) A tsunami significantly harms Japan’s productive capabilities D) There is a scare over potential armed conflict between Japan and China over disputed islands. 4. (10 points). Suppose the Fed engages in open market purchases. How will this affect the money supply? On two graphs, indicate and explain how this will affect interest rates, and how it will affect prices and output at the national level. The median on this exam was 56; the high was 92. Econ 201a Exam #4 Winter, 2012 Professor Twomey Student Name Part II Use the last page if you need more space. 1. a. b. Identify the following with a sentence or at most two: (16 points) Global savings glut Monetary Policy Rule c. Foreign Exchange controls d. Chancellor of the Exchequer 2. a. (10 points) Draw a graph of a Phillips curve, being sure to label each axis. b. Will the following lead a movement along the Phillips curve, or a shift? In each case, indicate with a graph the resulting movement.The world price of oil falls The Central bank raises domestic Interest rates Personal income taxes are reduced. c. Identify the three tools the Federal Reserve can use to control the money supply 3. (10 points) Suppose an economy experiences the situation in the accompanying graph. To eliminate the gap, should the Central Bank use expansionary or contractionary policy? If the central Bank engages in that policy, what will be the changes in: the interest rate, investment spending, consumer Spending, real GDP, and, the price level? 4. a. b. c. (13 points) Draw a graph illustrating the determination of the exchange rate between the Japanese Yen (¥) and the US dollar ($), being sure to label each axis. In terms of the supply curve that you have drawn, is it affected by US exports or US imports? Is it affected by capital flows into the US, or flows out of the US? Will the following lead to an appreciation or A depreciation of the US dollar? Illustrate Each answer with a graph showing ‘before and after’ curves. The US president has a heart attack. Inflation occurs in Japan The Japanese central bank engages in contractionary monetary policy. Econ 201b Exam #4b Winter, 2012 Prof. Twomey Student Name Part II Use the last page if you need more space. 5. e. f. g. Identify the following with a sentence or at most two: (16 points) a. Golden age of capital flows Federal Funds Market Foreign Exchange controls Savings and Loan Crisis b. a. (10 points) Draw a graph of a Phillips curve, being sure to label each axis. b. Will the following lead a movement along the Phillips curve, or a shift of the curve? In each case, indicate with a graph the resulting movement. Personal income taxes are increased. The world price of oil rises Financial crisis leads Europe to buy fewer American products c. On a different topic, what are the three defining functions of money? c. (10 points) Consider a situation where the central bank increases the money supply. On parallel, separate graphs, illustrate and explain how that would affect the money market, and then aggregate demand and aggregate supply. Just for clarification: does this increase or decrease employment? Does it increase or decrease prices? Econ 201 Exam #4 Summer, 2012 Prof. Twomey Student Name Part II. Use the back of the last sheet if you need more space 1. (16 points) Identify the following with a sentence or at most two: a) Bretton Woods b) Target Federal Funds Rate c) Monetary Base d) Glass-Steagall 2. (10 points) Draw a graph of the supply and demand for money (liquidity preference model), being sure to label each axis. Illustrate on that graph what would be the effects of an increase in the money supply, and explain how that would affect the national economy. Identify two macroeconomic variables that affect the demand for money. For each one, state whether it would have to increase or decrease in order to increase the demand for money. What are the three tools the Fed has to affect the money supply? For each one, state whether it would have to increase or decrease in order to cause an increase in the money supply. 3. (10 points) In economics there is a school called Monetarism. Write the basic equation that is at the core of monetarism, being sure to identify each variable. 4. What do monetarists predict will be the effect on prices and output of an increase in the money supply? Compare and contrast their predictions with the standard (textbook, Keynesian) analysis of increase in the money supply, as described in our textbook. (graph optional) The most famous monetarist, Milton Friedman, long supported a “Monetary Policy Rule.” What is meant by that term, and what are/were the supposed advantages of following it? 5. Draw a graph of the determination of the equilibrium exchange rate between the British Pound (£) and the U.S. dollar, being careful to label each axis Will the following lead to an appreciation or a depreciation of the dollar? Illustrate each answer with a separate graph. a. There is inflation in the U.S. b. Britain experiences significant growth of technology, due to improvements in its educational system. c. The loss of confidence in the Euro spreads to the British banking system, leading British speculators to withdraw their money. Econ 201 Exam #4 Fall, 2011 Professor Twomey Student Part II. (Let me know if you need more paper). 1. (16 points) Identify the following with a sentence or at most two: a. Liquidity trap b. Velocity of money c. Bank run d. Investment bank 2. (10 points) Terrible threes. a. Identify and explain briefly the three roles that define money b. Identify, and thereby distinguish between, the three following interest rates: federal funds rate, discount rate, and prime rate. c. Identify, and therefore explain the differences among: i. Inflation targeting ii. Monetary policy rule iii. Taylor rule 3. (10 points) Suppose the central bank causes the quantity of money to increase. Describe how that affects the economy, illustrating your answer with separate graphs, for the interest rate, AS/AD, etc. 4. (13 points) Draw a graph illustrating the determination in London of the exchange rate between the British pound (£) and the US dollar. On the graph, identify whether it is US exports or US imports that affect supply and demand. Do the following lead to an appreciation or a depreciation of the dollar? Illustrate each answer with a graph. i. Inflation in the US Ii Technological change in England Iii Interest rates rise in the US The median on this exam was 51; the high was 95. Econ 201 Exam #4 Winter, 2011 Professor Twomey Student Name: ______________ Please circle the letter corresponding to your answer on the multiple choice questions. The weight of the multiple choice questions is three points apiece. Please ask for clarification of any ambiguous question. Time: 90 minutes. Good luck. PART II (If you need more space, use the bottom part of the last sheet). Identify the following with a sentence or at most two: (16 points) A) Okun’s Law B) Liquidity Trap C) Golden Age of Capital Flows D) Inflation Tax 2. (10 points) Suppose a country is attempting to keep a fixed exchange rate with respect to a major international currency, such as the dollar. Now, consider the situation where that country has a balance of payments deficit. Identify and explain briefly three different policies this country could attempt, in order to maintain that fixed exchange rate. (no graph needed) 3. Draw a graph of the determination of the equilibrium exchange rate for the US dollar, in Europe, where their currency is the Euro (€). On that graph, indicate which curve is affected by US exports, and also, which curve is affected by capital flows from the US to Europe. (13 points) State whether the following will lead to an appreciation or a depreciation of the US dollar, and illustrate each answer with a separate graph. a. Inflation in Europe b. Technological change in the US c. Recent events threaten a breakdown of the European Monetary System, and the disappearance of the Euro. 4. How will the following affect inflation and unemployment? Explain, illustrating each answer with either a graph of the Phillips curve, or the AS-AD graph. (10 points) a. The U.S. authorities decide to attempt to balance the budget by decreasing government expenditures. b. Due to events in oil producing countries, the world price of oil rises. The Federal Reserve reduces the money supply. The median on this exam was 60: the high was 87. Econ 201b Exam #4 Fall, 2010 Professor Twomey Student Name: _________________ Part II. If you need more space, use the back of the last sheet. 1. Identify the following with a sentence or at most two: (16 points) a. Bretton Woods System b. Federal Funds Rate c. NAIRU d. Inflation targeting 2. (10 points) Draw a graph of the market for US dollars in London, where the currency is denoted by £. In terms of your graph, which curve is affected by US exports? Which curve is determined by capital flows from the UK to the US? Will inflation in the U.K. lead to an appreciation or a depreciation of the US dollar? Illustrate your answer with a graph. Will an increase in interest rates in the Unite States lead to an appreciation or depreciation of the US dollar? Illustrate your answer with another Graph. 3a. (13 points)Draw a graph of the demand for money, in terms of the liquidity preference model, being sure to identify the variable on each axis. Identify two economic variables that affect the demand for money, and state what would have to happen to each variable to move the money demand curve out and to the right. 3b. Draw a graph of the short run Phillips curve, being sure to label each axis. Will the following lead to a shift of the curve, or a movement along the curve? Illustrate each answer with a separate graph. i) The government lowers spending ii) The price of oil falls iii) The Central Bank increases the supply of money 4 (10 points) Suppose the Central Bank engages in open market sales of government securities. In the short run, what impact will this action have on output, employment, prices, and interest rates? Illustrate the impact of this policy using an AS-AD graph. Now, consider the economies of Albernia and Brittania, which have very different money demand curves, shown below. In which economy would open market sales be a more effective countercyclical policy tool? Explain briefly. The median on this exam was 56; the high was 77. Econ 201a Exam #4 Fall, 2010 Professor Twomey Student Name: _________________ For the multiple choice questions, please circle the letter corresponding to your answer. Please ask for clarification if any question is unclear. Time: unlimited, which means about 90 minutes. Good luck. Part II. If you need more space, use the back of the last sheet. 1. Identify the following with a sentence or at most two: (16 points) a) Taylor Rule Real exchange rate Exchange Rate Mechanism (not Regime, but Mechanism) b) Monetary neutrality 2. a. b. (10 points) Draw a graph of the market for US dollars in Japan (whose currency is indicated with a Y). On that graph, identify which curve is affected by US imports, and which by capital flows from Japan to the US. If the US has more inflation than Japan, will there be an appreciation or depreciation of the US$? Explain and illustrate with another graph. If the US Central Bank raises our interest Rates, will that lead to an appreciation or Depreciation of the US$? Explain and Illustrate with yet another graph. 3. c. (13 points) a. Suppose the Federal Reserve engages in open market purchases. In the short run, how will this affect our output, employment, prices, and interest rates? Illustrate this process with an AS-AD graph. b Macroeconomists often distinguish between short run and long run affects of policies such as open market operations. How will the long run effects on output, employment, prices and interest rates be different from the short run effects? Explain very briefly, no graph needed. During the Depression of the 1930s, business people of the US were very pessimistic about the future of economic growth, and were reluctant to invest. How might this have affected the potential for monetary policy to help alleviate the Depression? Explain briefly. 4. (10 points) Draw a graph of the Phillips curve, being sure to label each axis. Will the following lead to a movement along the Phillips curve, or a shift of the Phillips curve? a. Congress lowers income tax rates. b. The price of oil increases c. The Federal Reserve adopts a policy of restriction of the money supply. The median on this exam was 58; the high was 92. Econ 201 Exam #4 Summer, 2010 Professor Twomey Student Name: _____________ The exam consists of two parts: multiple choice and short answers. The multiple choice questions are worth three points apiece, and the weight of the other questions is indicated below. Please answer on these sheets. For the multiple choice questions, circle the letter that corresponds to your answer. Please ask for clarification of any unclear question. Time: whatever you need, which shouldn’t be more than 90 minutes. Good luck and have a nice summer Part II. If you need more space, use the back of the last sheet. Identify the following with a sentence or at most two: (16 points) Inflation targeting NAIRU c. Monetary neutrality (Friedman’s) Monetary Policy Rule (5 points) What are the three tools of monetary policy for the Federal Reserve in the US? In each case, state what would be done with them in order to decrease the money supply. (No graph necessary) 5 points) Draw a graph of the money market, according to the liquidity preference model. Explain how the following will affect that market, and therefore the interest rate? (graphs optional) Prices increase across the economy Increased use of credit cards and ATM machines. (13 points). From January 1, 2001 to June, 2003 The US federal funds rate decreased from 6.5% to 1%. During the same period, the marginal lending facility rate at the European Central Bank (roughly parallel to the federal funds rate) decreased less, from 5.75% to 3%. How should we expect these changes in interest rates would affect capital flows between the US and Europe? The accompanying diagram shows the Exchange rate between the Euro and The US dollar from January, 2001 through 2008. For the period 2001 – 2003, there was a very slight increase. Is this movement in the exchange rate consistent with the movement of capital flows discussed above? Explain your answer, and illustrate it with a graph. During the period 2003 through 2008, the US government increased its spending significantly for overseas military purposes. Is the decline in the euro/$ exchange rate In the above graph consistent with that increase in spending? Explain. The median on this exam was 47; the high was 59. Econ 201 Exam #4b Winter, 2010 Professor Twomey Student Name: ________ If you are in the 9:55 class, please indicate that below your name. If any question is unclear, please ask for clarification. Please circle the letter corresponding to the answer you select. The multiple choice questions are valued three points apiece. The weights of the questions in Part II are indicated below. Good luck. Part II 1 (16 points) Identify the following with a sentence or at most two: Monetary neutrality Foreign exchange controls NAIRU Target Federal Funds Rate 2. (10 points) Consider an economy in the situation depicted in the accompanying graph. Does it have an inflationary gap or a recessionary gap? To eliminate that gap, should the country’s Central Bank engage in expansionary or contractionary monetary policy? Assume that the central bank imposes the type of policy you mentioned above. How will that affect: the interest rate, business investment spending, real GDP and the price level? 3. (10 points) Draw a graph of the Phillips curve, being careful to label each axis. How will the following affect unemployment and inflation in the short run? Explain and illustrate each answer with a Phillips curve graph. a. The newly elected government decides to eliminate the deficit by raising taxes b. The world price of oil falls c. Increasing labor militancy makes wages much more sensitive to inflation 4. (13 points) Suppose that between January 2, 2007 and January 2, 2008 exchange rates changed: from US dollar 1.97 to buy 1 British pound, to 2.0 US dollar to buy one British pound, and from 118 Japanese Yen to buy one US dollar, to 109 Japanese Yen to buy one dollar. Did the US dollar appreciate or depreciate during 2007? Did this change in the US dollar make American goods more or less attractive to foreigners? Explain 5. Draw a graph of the determination of the equilibrium exchange rate of the US dollar in Europe. Will the following lead to an appreciation or a depreciation of the US dollar?Explain and illustrate each answer with a graph. i) European interest rate rise ii) The US has inflation iii) Europe’s inability to solve the Greek financial crisis leads to a loss of confidence in the Euro. Econ 201a Exam #4 Winter, 2010 Professor Twomey Student Name: ____________ If you are in the 11:55 class, please indicate that below your name. If any question is unclear, please ask for clarification. Please circle the letter corresponding to the answer you select. The multiple choice questions are valued three points apiece. The weights of the questions in Part II are indicated below. Good luck. Part II: Identify the following with a sentence or at most two: (16 points) a. Bretton Woods b. Real Exchange rate c. Taylor Rule d. Okun’s Law 2. (10 points) Is the economy described in the attached graph facing a recessionary gap or an inflationary gap? To eliminate that gap, would the country’s central bank use expansionary or contractionary monetary policy? Indicate how that monetary policy would affect the interest rate, investment spending, real GDP, and the aggregate price level. 3. (10 points) Draw a graph of the Phillips curve, being sure to label the axes. Explain briefly, and illustrate each answer with a different graph, how the following will affect unemployment and inflation in the short run: a. The government decides to lower income taxes, and sends us all a tax rebate. b. Conflicts in the Mid-East lead to an increase in the world price of oil. c. The prospect of the election of a “wacko” president – whoever that might be – leads business leaders to reduce their purchases of factories and machinery. 4.. (13 points) Draw a graph illustrating the determination of the exchange rate between the U.S. dollar and the British pound (£). Be sure to label each axis. On that graph, indicate which line is affected by US exports, and which by capital flows from Britain to the US? Will the following lead to an appreciation or depreciation of the US dollar? Explain briefly, illustrating each answer with a graph. a. Britain has more inflation than the US. b. British businesses benefit from improved technology, making their exports more attractive in world markets c. The British central bank raises its interest rate. Econ 201 Fall, 2009 Exam #4 Professor Twomey Student Name: ________________ Please circle the letter corresponding to your answer. Ask for clarification if any question is unclear. The multiple choice questions are worth 3 points apiece. Time: the entire class. Good luck! Part II Use the backsides of these sheets if you need more space. Identify the following with a sentence or at most two (20 points): Savings and Loan Crisis Bretton Woods Commodity Money Taylor Rule Discount window 2.. (9 points) What are the three tools the Federal Reserve has to affect the money supply? For each one, state what would have to be done to that tool to increase the money supply. 3. (10 points) What is meant by the liquidity preference model of the determination of interest rates? Draw a graph illustrating the model, being careful to label each axis. b. In that model, what happens to the equilibrium interest rate if income rises? Show on a separate graph. c. In that model, what happens to the equilibrium interest rate if the quantity of money declines? Show on a separate graph. 4. (10 points) Consider the market for dollars in Japan. Draw a graph (being sure to label the axes) of the determination of the equilibrium exchange rate between the Yen (Y) and the US dollar ($). On that graph, indicate which curve reflects US exports to Japan, and which one reflects capital flows from Japan to the US. a. Does the dollar appreciate or depreciate in the following circumstances? Illustrate each answer with a graph b. The US has more inflation than Japan c. Interest rates in the US increase. d. A political crisis in Japan causes the Prime Minister to resign, leaving much uncertainty about the country’s future. Econ 201 Exam #4 Summer, 2009 Professor Twomey Student Name: ________________ In the multiple choice section, please circle the letter corresponding to your answer. Time: unlimited. If a question is unclear, please ask for clarification. Good luck. Part II Identify the following with a sentence or at most two (16 points): Bretton Woods Monetary Neutrality Taylor Rule Global savings glut 2. (10 points). A. Draw the graph depicting the determination of the interest rate, using the liquidity preference model. Identify two factors that determine the demand for money, and state whether those factors would have to increase or decrease, in order for the demand for money to shift to the right. b. Use the liquidity preference model to explain why the Federal Reserve has been increasing the money supply recently. c. How does the concept of liquidity trap affect the logic of that policy? (10 points). Draw a graph of the short run Phillips Curve, being sure to label the axes. Identify and explain very briefly whether each of the following will cause a shift of the Phillips curve, or a movement along it. Illustrate each answer with a separate graph, indicating ‘before’ and ‘after’ points. The government decides to raise taxes in order to balance the budget Recent elections bring to office someone who the general public believes will engage in inflationary policies The price of oil falls dramatically (13 points) Draw a graph of the determination of the equilibrium exchange rate between Japan (whose currency is the Yen (¥), being sure to label the axes. With regard to the S and D lines, identify the role played by US exports, and capital flows from the US to Japan. What will be the effect of technological change in the US on the exchange rate? Illustrate with another graph What will be the effect on the exchange rate of a reduction in interest rates in the US? Illustrate with another graph. Suppose that, initially, the exchange rate was 200¥/$, and that after five years, the Japanese price index was at 120 (relative to the initial year), while the US price index was 140. According to the purchasing power parity theory, what should be the new equilibrium exchange rate? The high on this exam was 94. The median on this exam was 48

