69 cards
 Jac0074, Tinycards Lover
MSC 385 Supply Chain Test 4 (Final Exam)
Decks complete; Public version 7 Kartka.ai link: https://app.kartka.ai/shared/decks/iFRKECs7cp4fRydVGXkoF6Ya
-
Lean Systems' Ultimate Goalto achieve a system that matches supply to customer demand
-
Lean Systems' Supporting Goalseliminating disruptions, making the system flexible, and eliminating waste, especially excess inventory
-
Lean Systems' Building Blocksproduct design, process design, personnel/organizational elements, and manufacturing planning and control
-
Warning about Pull SystemsLarge variations in volume, product mix, or product design will undermine the system
-
Requirements for Implementing LeanHigh quality, highly capable production systems, standard parts, a modular design, concurrent engineering, a spirit of cooperation among workers, management, and vendors, and a pull system
-
Differences between project management and general operations managementProject management has a limited timeframe, narrow focus, specific objectives, and it is less bureaucratic
-
Project managers' responsibilitiesEffectively managing the work, human resources, communications, quality, time, and costs
-
Reason why waiting lines can form even when there is enough capacityArrival and service rates are variable
-
Activities that have slack timeActivities that are not on the critical path
-
Fact about the critical pathIt does not have slack time.
-
Reasons to use leanIt reduces waste, continuously improves, minimizes inventory, it has high quality, small lot sizes, quick changeovers, and matches output to demand
-
factor that allows quick changeoversSingle-minute exchange of dies
-
PERTProgram evaluation and review technique
-
PERT chartA sequence of relationships and orders that activities have to be deployed in
-
What to do when deploying activities on a PERT chartNumber the nodes on the chart
-
Number of Individual Steps in the "Mercury Marine Lean" video's process122
-
Number of Production Steps in the "Mercury Marine Lean" video's process27
-
Travel Distance in the "Mercury Marine Lean" video's process20,793'
-
Number of People who touched the unfinished product in the "Mercury Marine Lean" video's process106
-
"HP Stockless Production": Space Used in the Push 6 System2 tables
-
"HP Stockless Production": WIP in the Push 6 System30
-
"HP Stockless Production": Cycle time in the Push 6 System3:17
-
"HP Stockless Production": Rework Quantity in the Push 6 System26
-
"HP Stockless Production": Type of Problems in the Push 6 SystemHidden
-
"HP Stockless Production": Space Used in the Pull 3 System2 tables
-
"HP Stockless Production": WIP in the Pull 3 System12
-
"HP Stockless Production": Cycle Time in the Pull 3 System1:40
-
"HP Stockless Production": Rework Quantity in the Pull 3 System10
-
"HP Stockless Production": Space Used in the Pull 1 System1 table
-
"HP Stockless Production": WIP in the Pull 1 System4
-
"HP Stockless Production": Cycle Time in the Pull 1 System:19
-
"HP Stockless Production": Rework Quantity in the Pull 1 System3
-
"HP Stockless Production": Type of Problems in the Pull 1 SystemVisible
-
Lean systems' ideal lot size1
-
Lean Process Design AspectsSmall lot sizes, setup time reduction, manufacturing cells, quality improvement, production flexibility, a balanced system, little inventory storage, and fail-safe methods
-
Small lot size benefitsSmaller work in progress, lower inspection and rework costs, greater scheduling flexibility, increase production flexibility, and it makes balancing operations easier
-
Lean operating with low inventories basic requirementHave suppliers deliver to the production floor
-
Lean Systems' Vendor Characteristicsthey are a small number of suppliers that are expected to provide frequent, small deliveries of high-quality goods
-
Things that require PERT's useEarly start, early finish, late start, and late finish
-
Work Breakdown StructureA hierarchal listing of what must be done during a project
-
Work breakdown Structure Step 1Identify the project's major elements
-
Work breakdown Structure Step 2Identify each major element's supporting activities
-
Work breakdown Structure Step 3Break down each major supporting activity into a list of activities that will be needed to accomplish it
-
Lean systems' eight wastesExcess inventory, overproduction, waiting time, unnecessary transporting, processing waste, inefficient work methods, product defects, and underused people
-
Excess inventory exampleAnything that is not necessary for the minimum buffers; any inventory above the minimum amount to meet daily demand
-
Overproduction exampleProducing more than is required for the daily demand
-
Waiting time exampleAny time spent waiting for parts; any unproductive time spent waiting
-
Unnecessary transporting exampleMost of the time the unfinished product was moved in the Mercury Marine Lean video
-
Processing waste exampleScraps and reduced yield, such is when a die cut process begins
-
Inefficient work methods exampleWhen people have to move too much or reach too much if moving objects closer together is possible
-
Product defects exampleAny kind of quality problem
-
Underused people exampleFailure to implement line balancing
-
Critical Path DefinitionThe longest sequence of activities from the starting node to the finishing node
-
Reason waiting can occur in infinite source queuing systemsCustomer arrivals are unrestricted
-
Effect when the arrival-rate-to-service-rate increases ;the number of arrivals increases but the service rate stays the sameThe answer's value increases
-
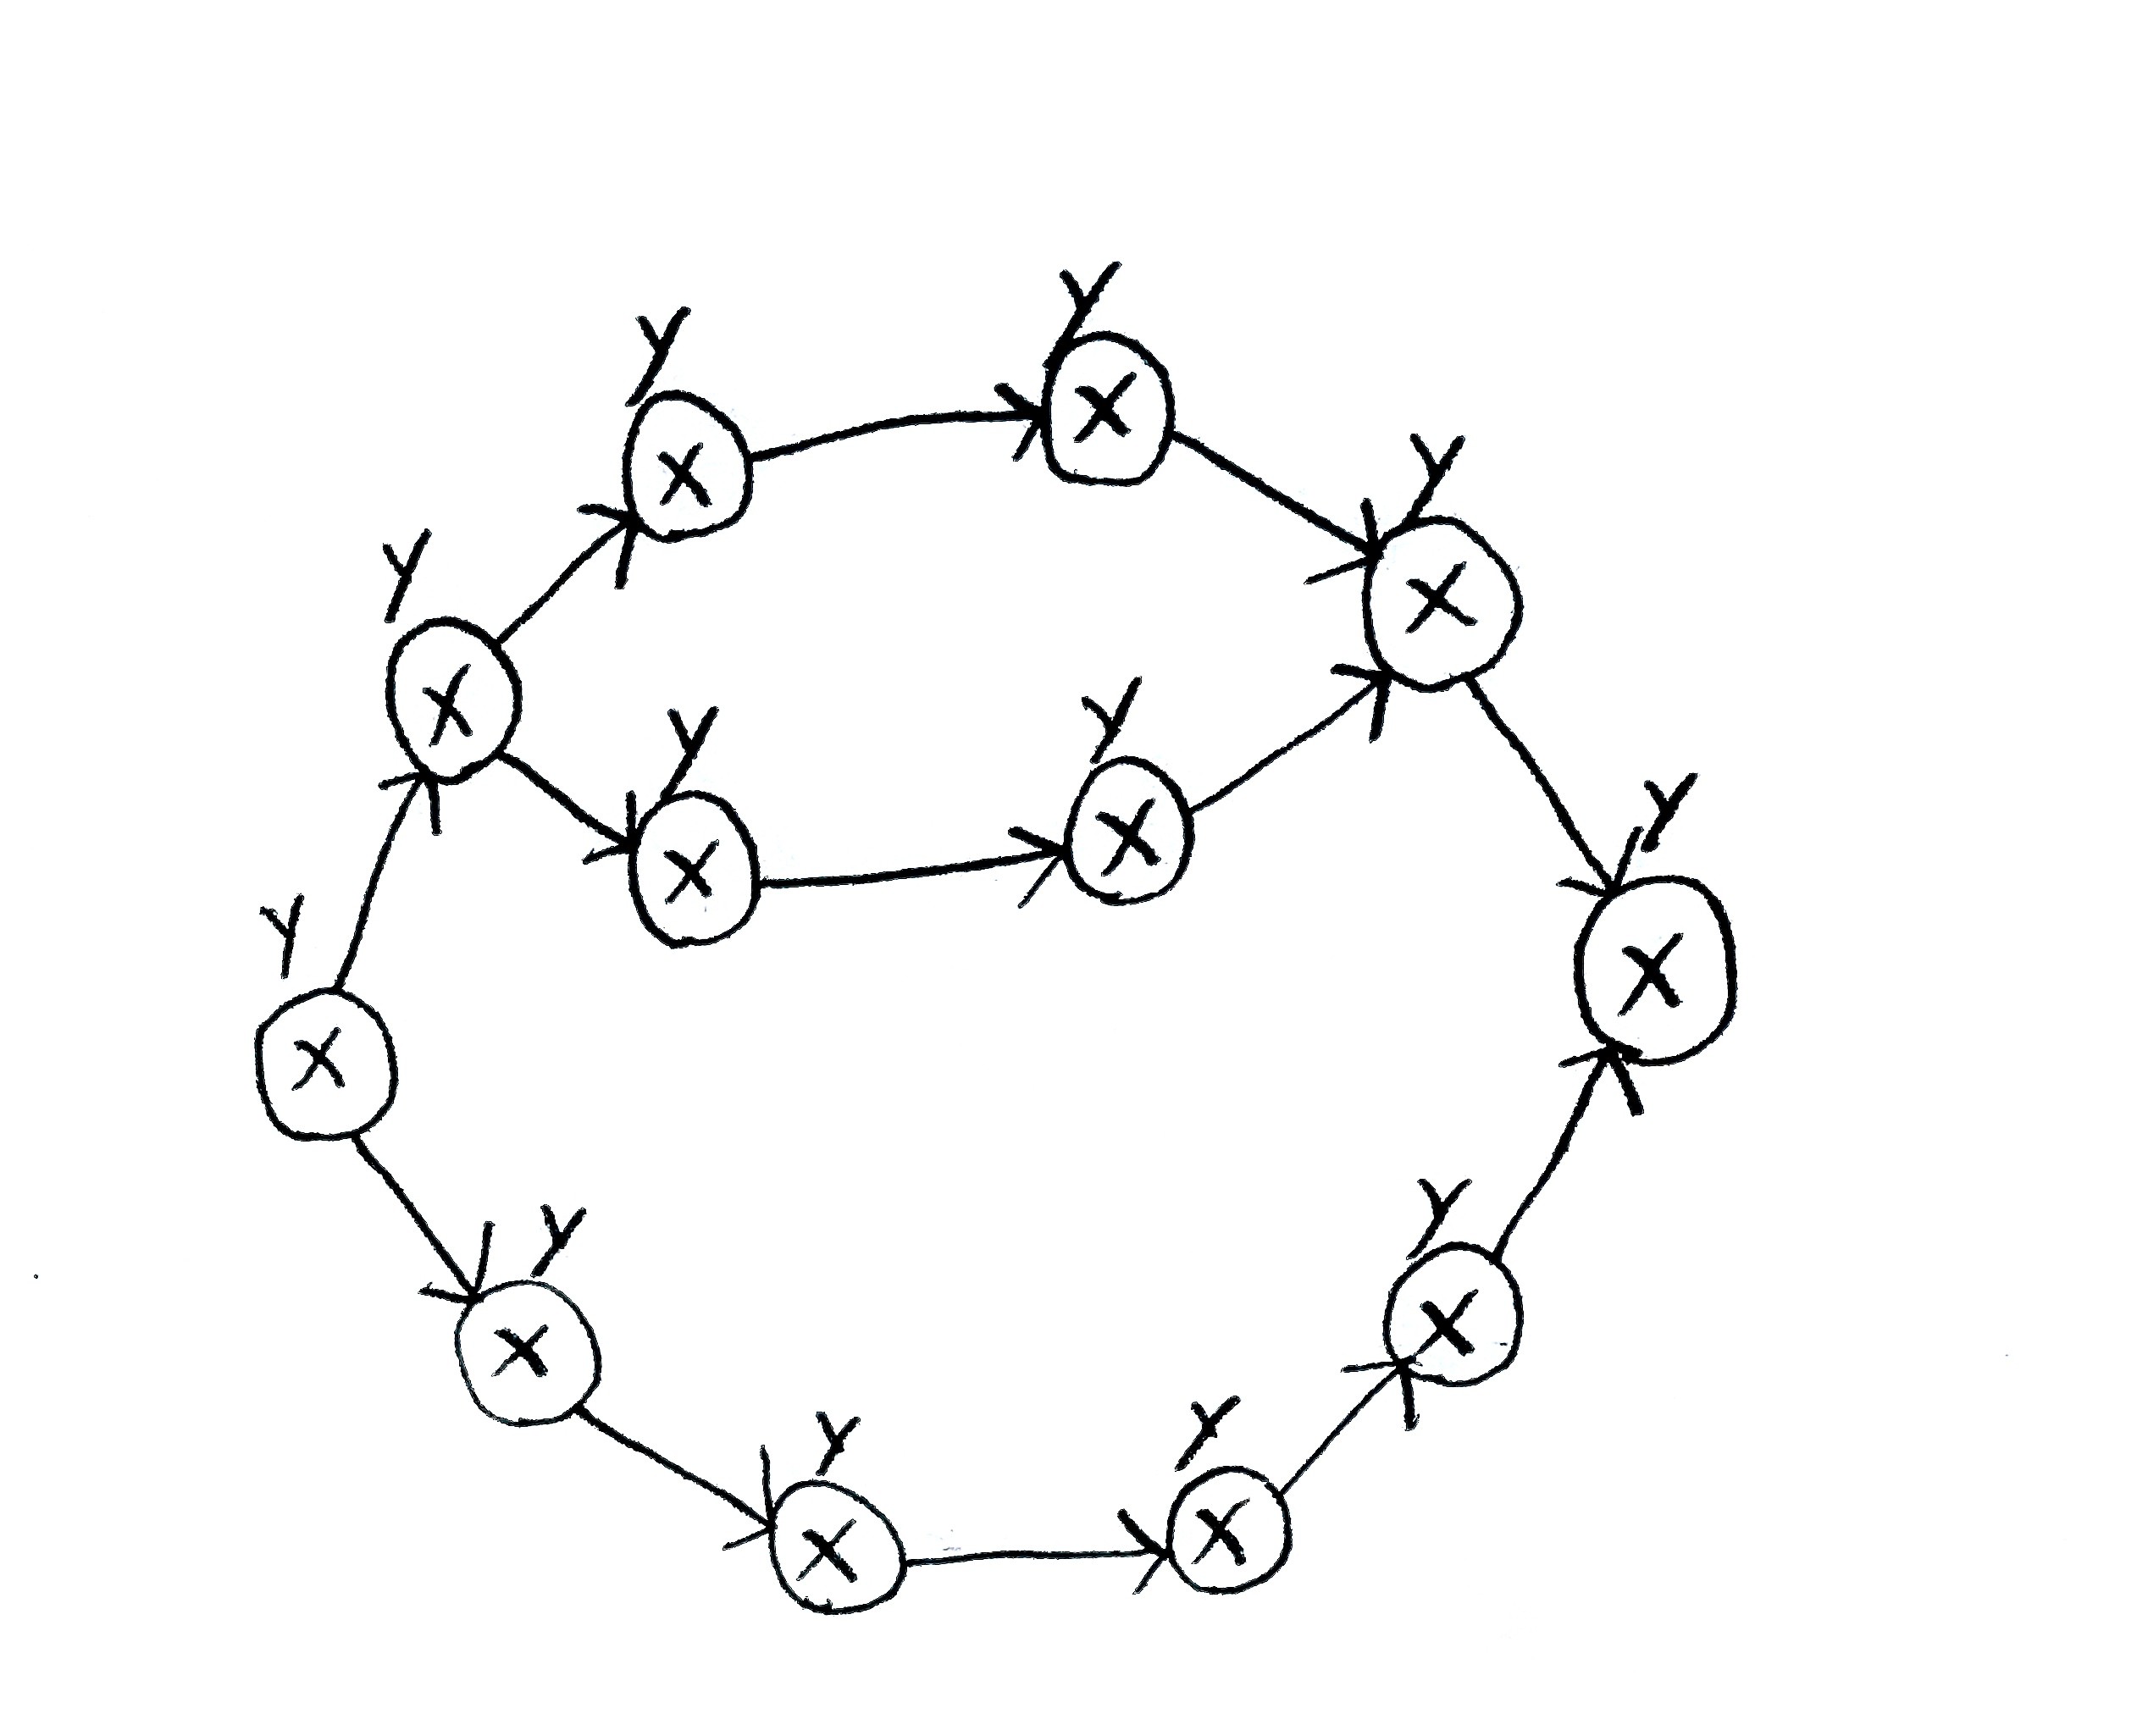 X’s on this PERT chartActivities’ name numbers (i.e., if one is 5, that activity is activity 5)
 -
 Y’s on this PERT chartActivities’ length numbers (i.e., if one is 5, that activity takes 5 days to complete)
 -
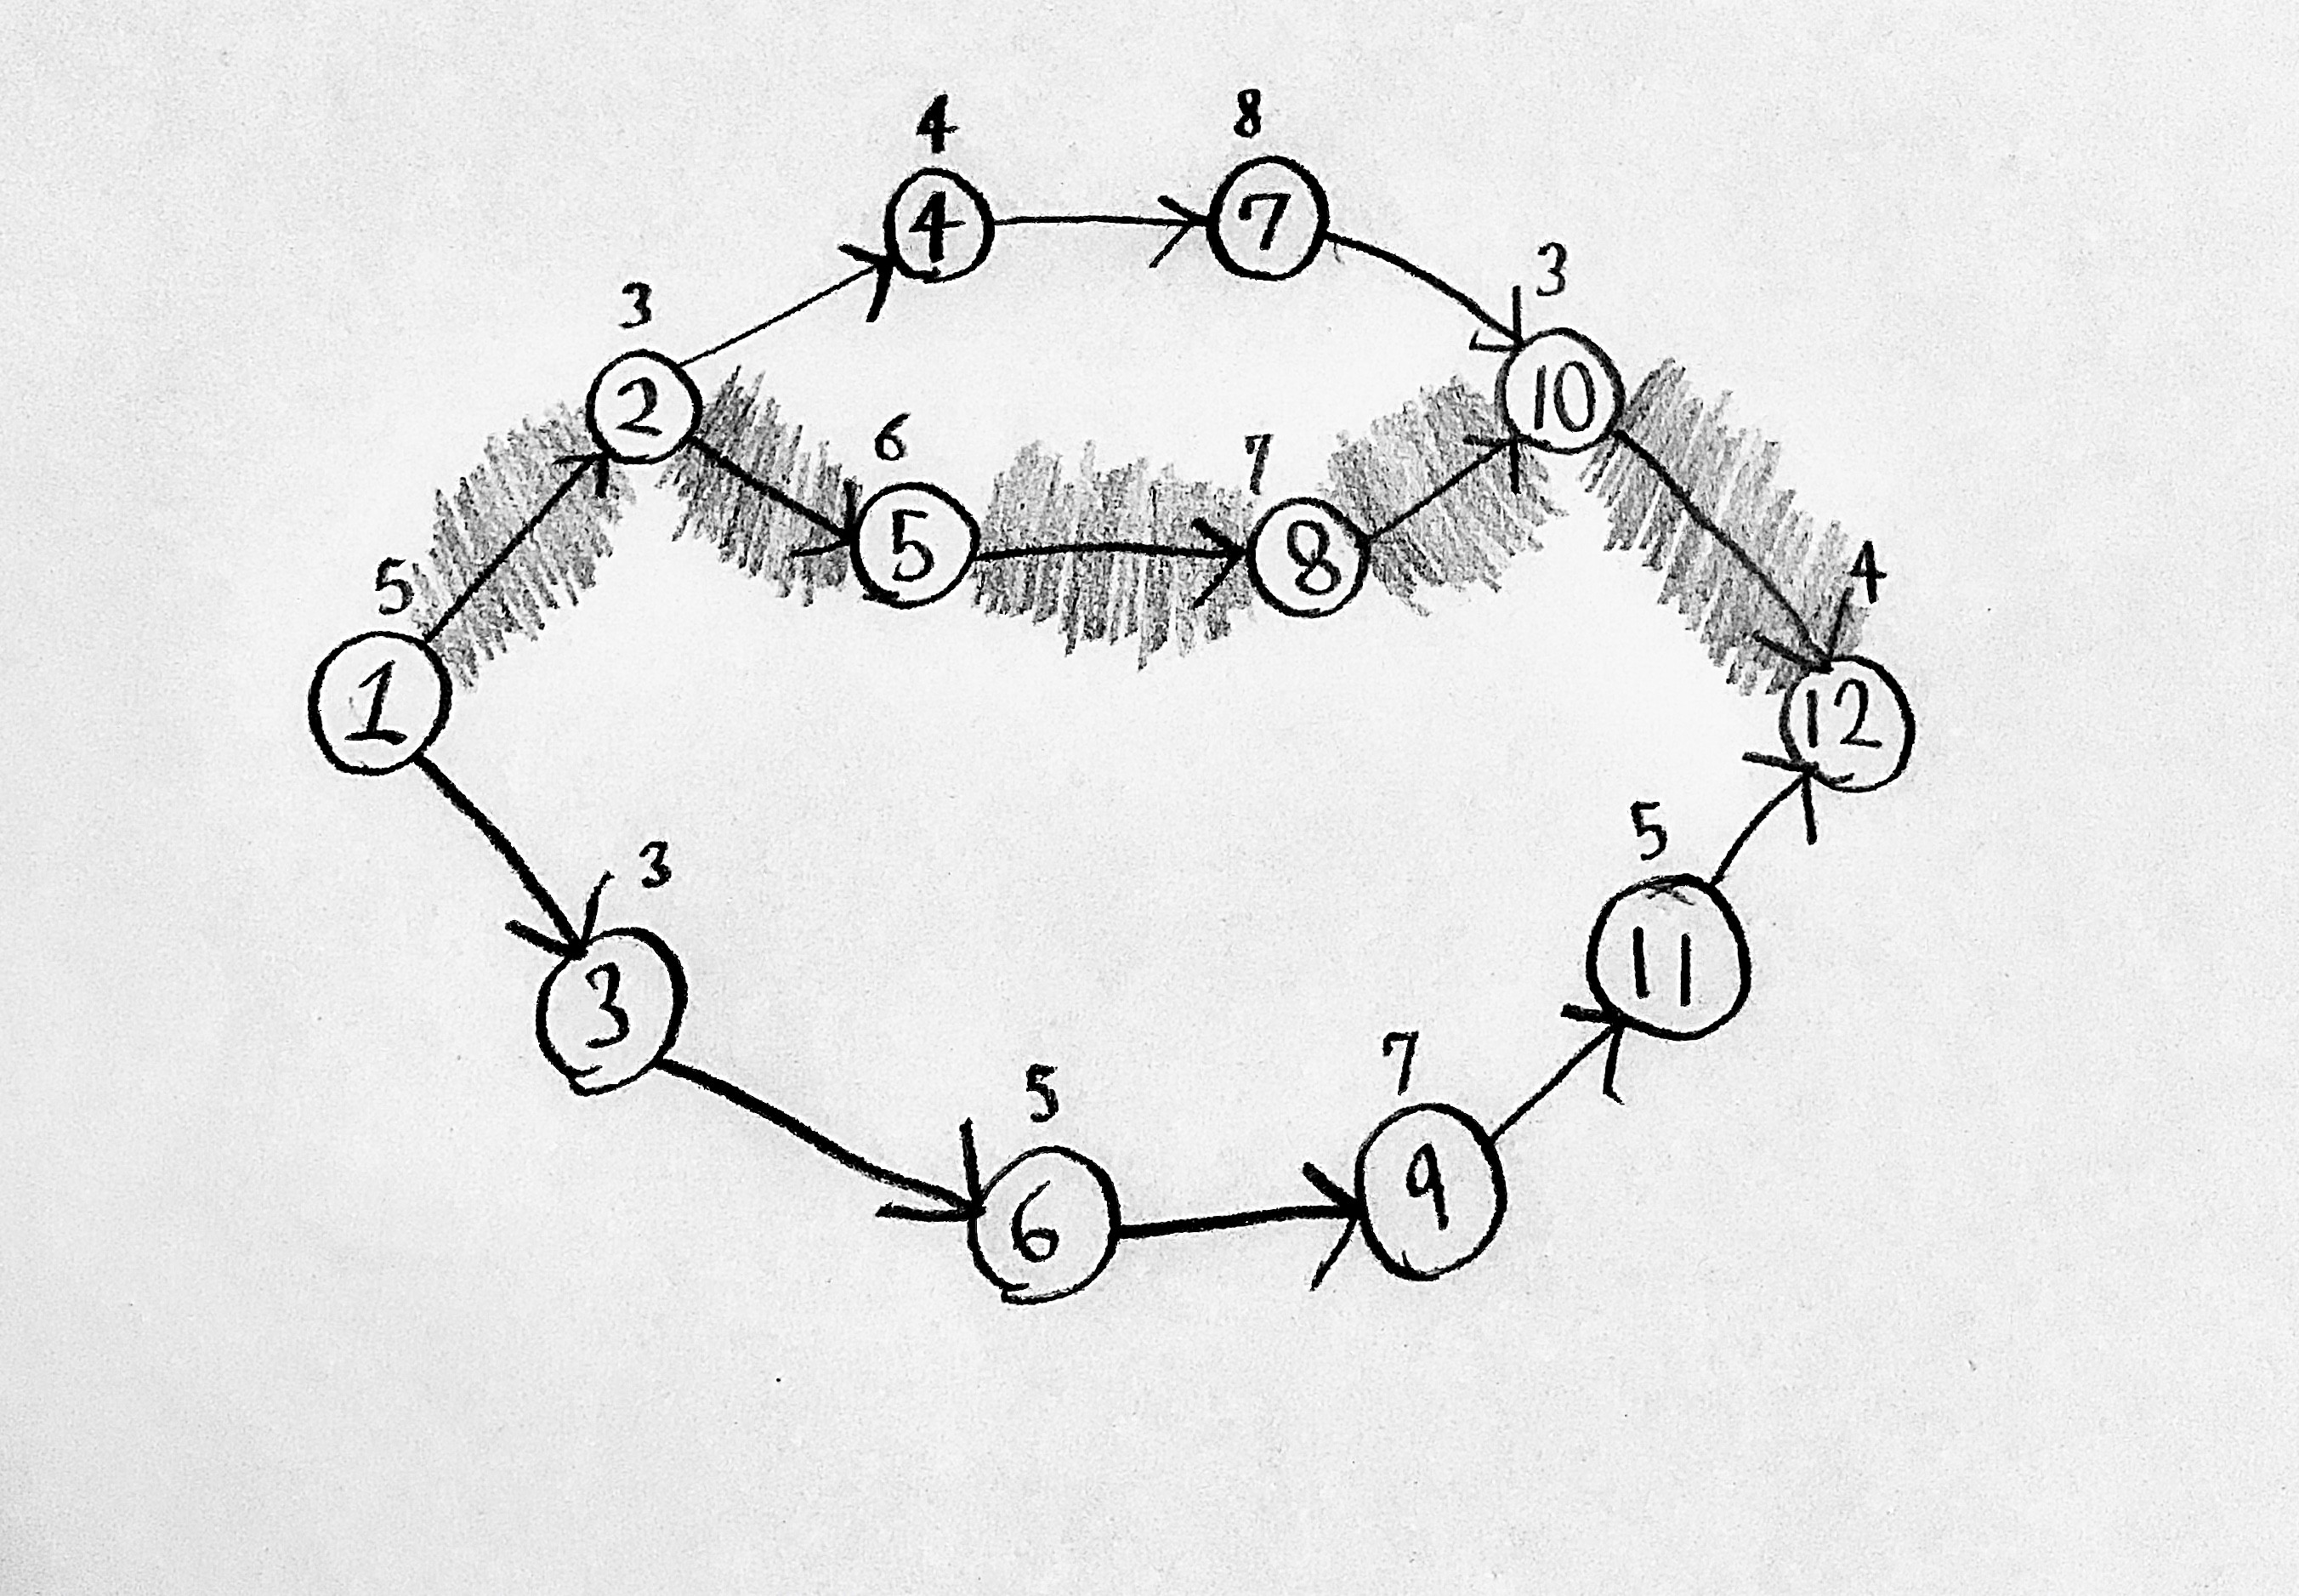 The shaded path’s name on this PERT chart1-2-5-8-10-12
 -
How to solve for the critical pathSum each of the paths’ activity numbers separately. The critical path has the highest sum.
-
Crashing a node effectThe node’s length in days is reduced.
-
How to choose which nodes to crashStart on the critical path and crash the cheapest node first.
-
What it means to crash a project for a certain number of daysCrash nodes on the project until all paths are the critical path's length minus the specified number of days or less
-
Effect on a system when its channel utilization is over 100%Its line will keep growing
-
Important step for calculating the number of kanban containersRounding the answer number up; i.e. 1.3 rounds to 2
-
How to tell if you can use fewer containers if the kanban system improvesSet X to zero and re-calculate the number of containers. If the new answer rounds to a smaller whole number than the original, the answer is yes.
-
Project management toolsWork breakdown structure, network diagram, Gantt chart, and risk management
-
Network diagram explanationThis "big picture" visual aid is used to estimate project duration, identify activities critical for timely project completion, identify areas with slack time, and develop activity schedules.
-
Gantt chart explanationThis is a visual aid used to plan and monitor individual activities.
-
Risk Management ExplanationThese are analyses of potential failures or problems, assessment of their likelihood and consequences, and contingency plans.

