68 cards
 Jac0074, Tinycards Lover
Microsoft Excel (from TinyCards)
Custom made for use with a computer class; teaches the use of functions and more in Microsoft Excel (This deck used to be on an amazing spaced-learning service called Tinycards.) (20 people favorited this deck on TinyCards.)
-
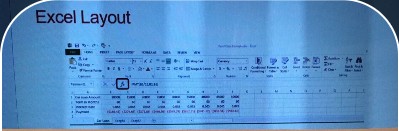
 workbook
 -
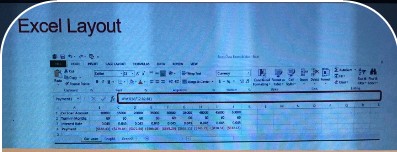
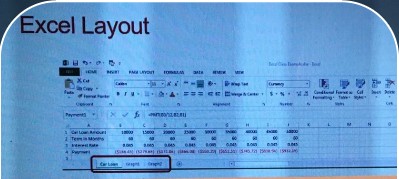 worksheets
 -
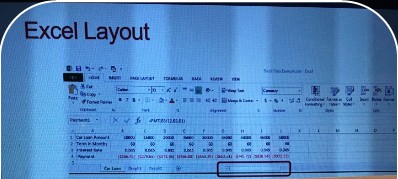 scroll bar
 -
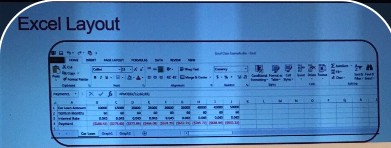
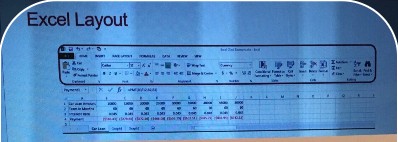 toolbars and menu
 -
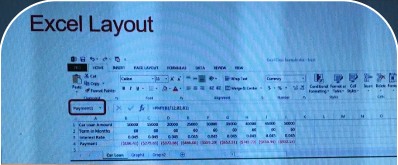 cell reference; type in this area to name a cell or cell range
 -
 formula bar
 -
 function help
 -
variable in Microsoft excelcell
-
uses of variables in Microsoft ExcelOne can be used to represent number, text (strings),Boolean (T/F), dates or other information
-
Naming scheme of cells in Microsoft Excelcolumn letter(s) followed by the row number ex. : A1
-
Addition in Microsoft excelSymbol: +; =A1+B1
-
Subtraction in Microsoft excelSymbol: -;=A1-B1
-
Multiplication in Microsoft ExcelSymbol: *;=A1*B1
-
Division in Microsoft ExcelSymbol: /;=A1/B1
-
Exponentiation in Microsoft ExcelSymbol: ^;=A1^B1
-
Negation in Microsoft ExcelSymbol: -; =-A1
-
Percent in Microsoft ExcelSymbol: %;=A1%
-
Boolean in Microsoft ExcelSymbols: =, <, >, =>, >=, <>;=A1>B1
-
Operator precedent for parenthesesinnermost first
-
Operator precedent for negation=-5*3 =-15
-
Operator precedent for percent=-5%*3 =-0.15
-
Operator precedent for exponentiationleft to right
-
Operator precedent for multiplication and divisionleft to right
-
Operator precedent for addition and subtractionleft to right
-
Operator precedent for comparisonleft to right
-
=SIN(A1)Returns the value of sine of the angle A1 in radians
-
=ASIN(A1)Returns the value in radians of inverse sine of A1
-
=COS(A1)Returns the value of cosine of the angle A1 in radians
-
=ACOS(A1)Returns the value in radians of inverse cosine of A1
-
=TAN(A1)Returns the value of tangent of the angle A1 in radians
-
=ATAN(A1)Returns the value in radians of inverse tangent of A1
-
= RADIANS(A1)Returns the conversion of A1 degrees to radians
-
=DEGREES(A1)Returns the conversion of A1 radians to degrees
-
=PI()Returns the value of pi
-
=EXP(A1)returns the value of a natural number to the power of the number in cell A1 (e^A1)
-
=LN(A1)returns the value of the natural logarithm of A1
-
=LOG(A1)returns the value of the base 10 logarithm of A1
-
=LOG(A1,2)returns the value of the logarithm of A1 to base 2
-
=10^A1returns 10 to the A1 power; inverse function of LOG
-
=MOD(A1)returns the modulus (similar to remainder) of A1
-
=SQRT(A1)returns the square root of A1
-
=AVERAGE(A:A)Takes an average of all values in column A
-
=STDEV(B1:C5)Finds the standard deviation in the range B1: C5
-
=MIN(RangeA)Finds the minimum value in the named range, Range A
-
=MAX('Sheet2'!A1:A6)Finds the maximum value in worksheet 'Sheet2' range A1:A6
-
=LARGE(1:10,2)Finds large values in rows 1:10, the 2 after the comma finds the second largest value
-
=SMALL (B3:B10,3)Finds small values in a range B3: B10, the three after the comma finds the third smallest value
-
=SUM(B:B)Sum of all values in column B
-
How to get function help in Microsoft ExcelClick on FX while in a blank cell to see a list of functions and function categories.> Enter a function in a cell.>Click on "Help on this function" to get detailed information with examples.
-
How to enter a series in Microsoft ExcelType the first two numbers in the series, select the two numbers, and click and drag the box in the lower right corner of the selection.
-
How to insert a chart into Microsoft ExcelSelect the data you would like to graph, then select the insert menu and select the desired type of chart.
-
The most used type of chart in engineering
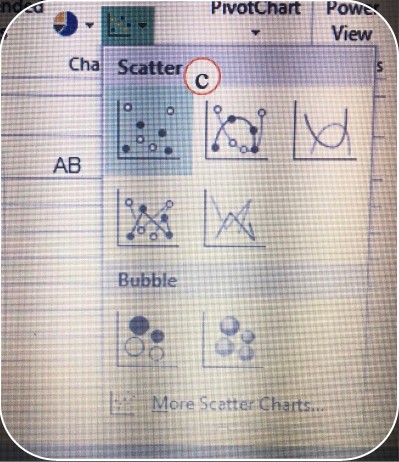 Scatter chart
 -
Type of chart useful for a histogramColumn chart
-
Type of chart useful for looking at project costsPie chart
-
Type of chart often suggested by Microsoft Excel (but usually a mistake to use in engineering)Line chart
-
description of "<" in Microsoft Excelless than
-
description of "<=" in Microsoft Excelless than or equal to
-
description of "=" in Microsoft Excelequal to
-
description of ">" in Microsoft Excelgreater than
-
description of ">=" in Microsoft Excelgreater than or equal to
-
description of "<>" in Microsoft Excelnot equal to
-
=AND(Subcondition 1, Subcondition 2,...)"And" conditional in Microsoft Excel;True or 1 if all subconditions are true
-
=OR(Subcondition 1, Subcondition 2,...)"Or" conditional in Microsoft Excel;True or 1 if one or more subconditions are true
-
=XOR(Subcondition 1, Subcondition 2,...)"Xor" conditional in Microsoft Excel;True if an odd number of subconditions are true
-
=NOT(Subcondition 1)"Not" conditional in Microsoft Excel;True if the subcondition is false
-
Conditional Format
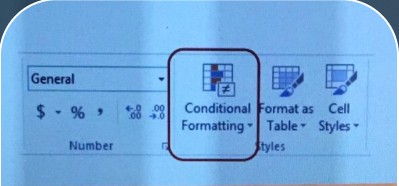 A way to change the cell format based on what is in the cell or in another reference (useful for highlighting certain results)
 -
Conditional Format Choicesnumber format, font format, border format, and fill format
-
How to insert a special trendline into a scatter plot
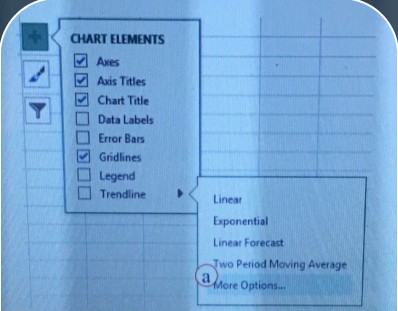 Select the Trendline submenu and more options, then change the options as desired in the Trendline format window

