70 cards
 Jac0074, Tinycards Lover
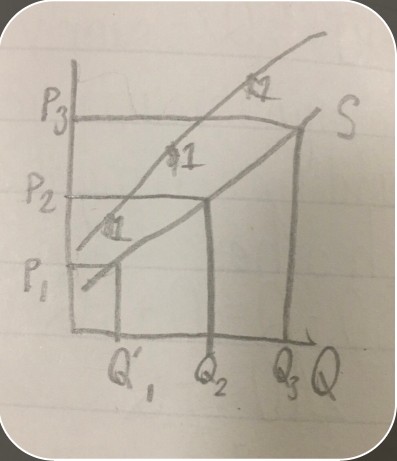
Macroeconomics 142 Test 1 (from TinyCards)
This deck, custom-made for a class, is complete with all material covered before and through Test 1. (This deck used to be on an amazing spaced-learning service called Tinycards.)
-
Economicshow we deal with scarcity
-
scarcitywhen there is enough demand for something but not enough of it
-
GDPGross domestic product
-
Factors of Productionland, labor, and capital
-
Landnatural resources
-
laborhuman input
-
capitalstuff that produces other stuff (electrical grids, hammers, etc.)
-
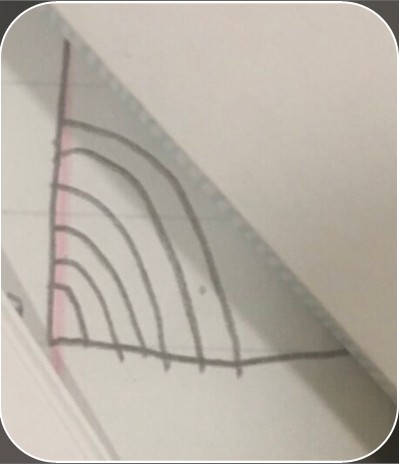
PPCProduction Possibilities Curve
-
 C=inefficiency D=impossible
 -
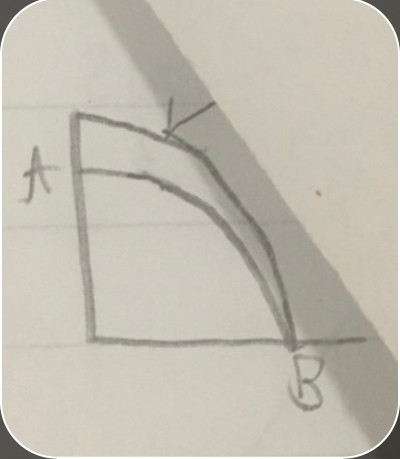 growth in section A but not B
 -
 PPC of a poor country receiving loans (showing that loans help it grow)
 -
reason why the PPC line is bentfactors of production are specialized
-
single most important model in EconomicsSupply and Demand
-
information the demand curve holdshow much of something people are willing to buy at certain prices
-
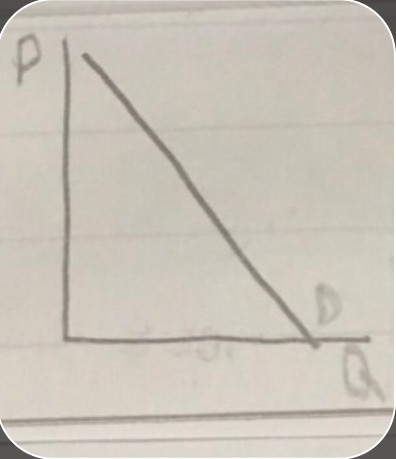 typical demand curve
 -
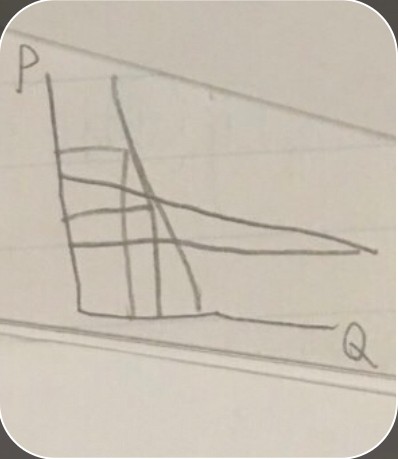 demand curves in markets insensitive to prices
 -
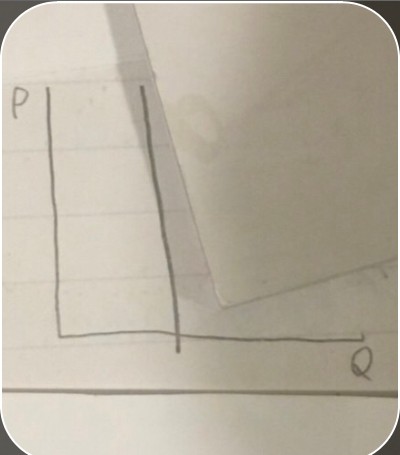 demand curve in market completely insensitive to prices
 -
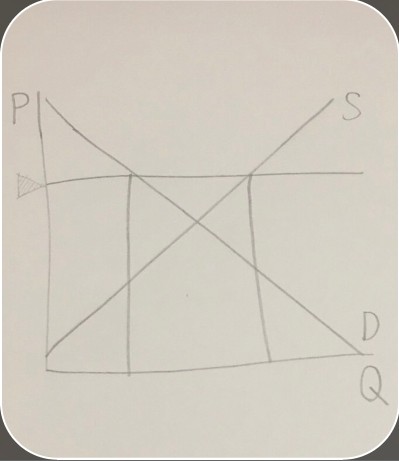
 demand curve with price ceiling
 -
signature feature of a demand curveit always has a downward slope
-
things that change demandtaste and preferences, income, price of related (“complement” or substitute) goods, and population
-
effect of change in quantity demanded on a demand curvethe point moves along the curve
-
effect of change in demand on demand curvethe entire curve is changed
-
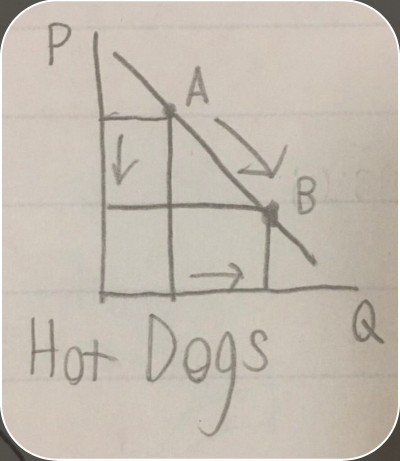 demand curve with change in quantity demanded
 -
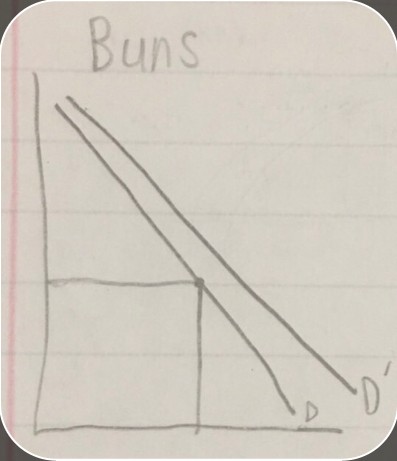 demand curve with change in demand
 -
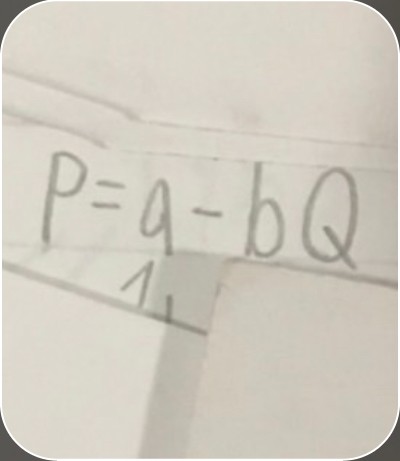 horizontal intercept in demand line equation
 -
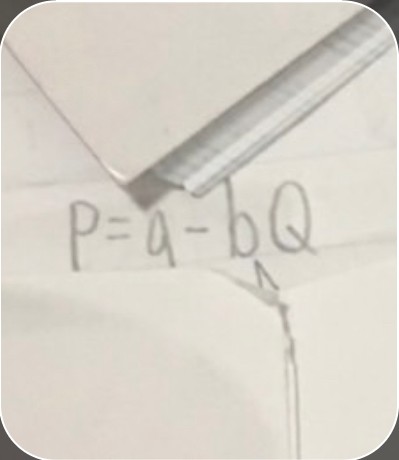 slope in demand line equation
 -
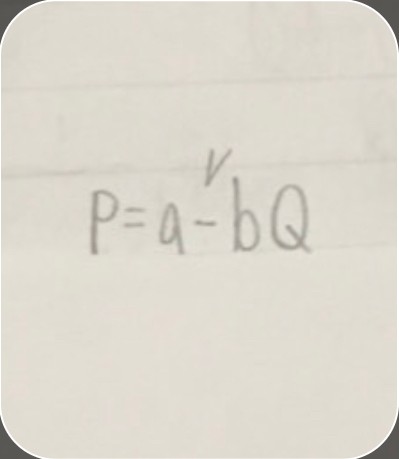 indicator of whether the equation is for a supply or demand curve
 -
Supply shiftsprice of inputs, technology, number of sellers, and price of related goods (complements and substitutes)
-
effect of change in the quantity of supplymoves the point along the line; this occurs due to a change in price
-
effect of change in supply on the supply curvethe entire line moves
-
supply and demand’s effect on each othersupply and demand don’t affect each other
-
complements in productiontwo products that are produced at the same time
-
substitutes in productionIf a company makes Good A, they can’t make Good B.
-
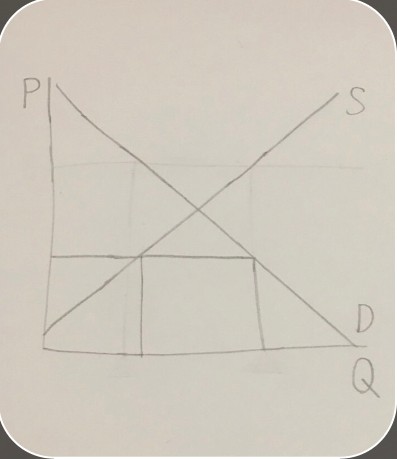
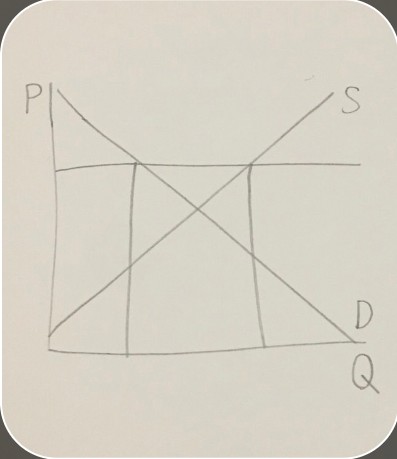
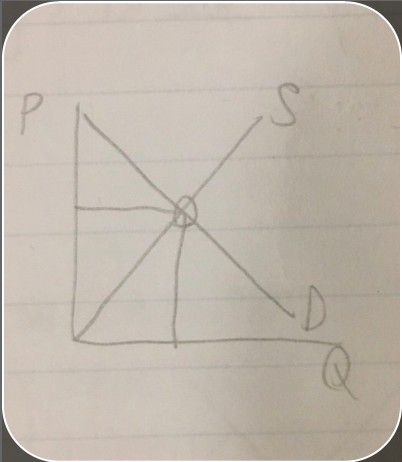 equilibrium on a supply and demand graph
 -
equilibriumthe point that supply and demand curves will move towards and stay at once reached
-
definition of gross domestic productmarket value of all final goods and services produced in a year
-
GNPGross National Product
-
difference between GDP and GNPGNP counts operations of a company based in a certain country, even if some operations take place in another country; GDP only counts operations in the same country
-
How to find the equilibrium price and quantity of a supply and demand curveSet the supply curve equation and the demand curve equation equal to each other to find Q’s value, then plug it back into the original to find P.
-
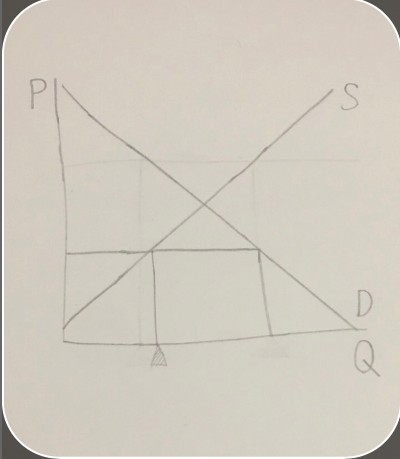
effect of a tax on a supply and demand curvethe supply line vertically shifts upward the monetary amount of the tax
-
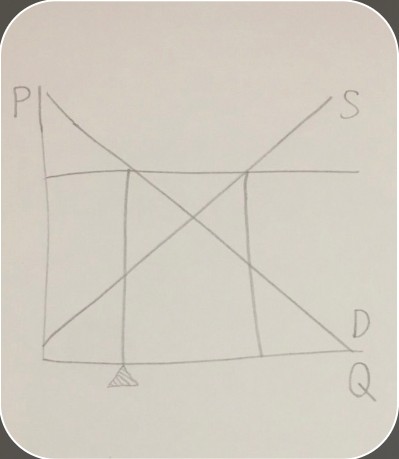
 graph of a shortage
 -
 quantity supplied on a shortage graph
 -
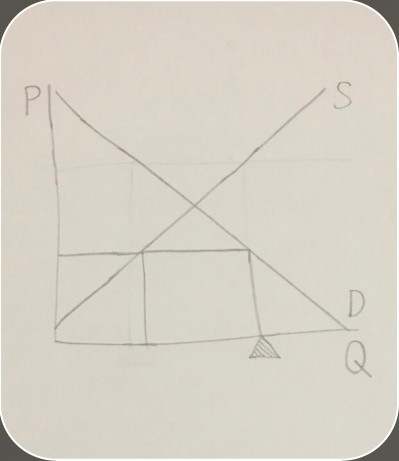 quantity demanded on a shortage graph
 -
two examples of how shortages can be createdby a price ceiling or an increase in income but not supply
-
how to calculate the size of a shortageSubstitute the price ceiling for P in the demand and supply curve equations to calculate Q for both, then subtract supply’s Q from demand’s Q.
-
real GDPGDP adjusted for inflation
-
problem with GDPit doesn’t record products that don’t officially go to market
-
things GDP misseshome production, crime, nonreported cash payments and leisure time
-
labor equilibriumfull employment
-
classical school thoughts on unemploymentit is a temporary disequilibrium and a result of wages being too high
-
NXnet exports
-
how to calculate net exportsexports-imports (X-M)
-
MPCmarginal propensity to consume
-
definition of marginal propensity to consumeadditional consumption generated by additional income
-
MPSmarginal propensity to save
-
value range of marginal propensity to consume0<MPC<1
-
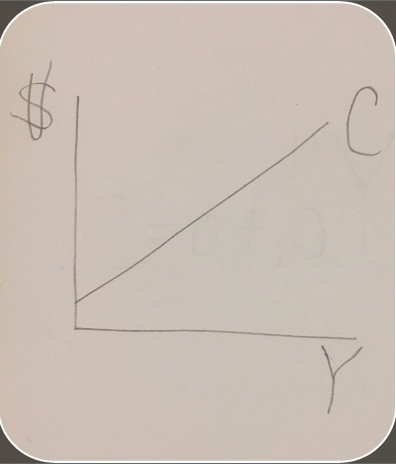
written consumption functionc=a+bY
-
graphed consumption function
-
a (in consumption function)y-intercept
-
Y (in consumption function)income
-
b (in consumption function)MPC (slope of the consumption function)
-
aggregate spendingC+I+G
-
C (aggregate spending)consumption
-
I (aggregate spending)firms
-
G (aggregate spending)government spending
-
investmenta change in capital stock
-
graph of a surplus
-
 price floor on a surplus graph
 -
 quantity demanded on a surplus graph
 -
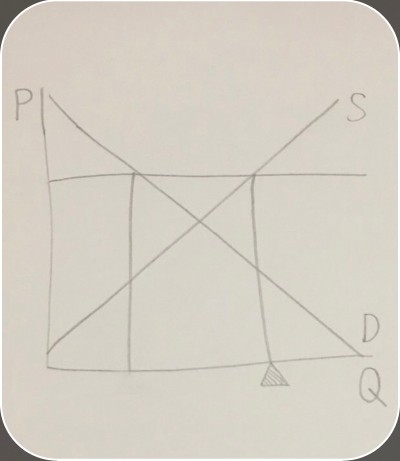 quantity supplied on a surplus graph

