 Diana Chavez
-
Dot plotA way of displaying data that has an order and can be placed on a number line. They are generally used when the data is discrete (separate and distinct) and numerous pieces of data fall on most values.
-
Histogram
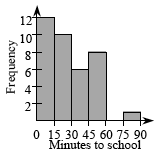 A way of displaying data that is much like a bar graph in that the height of the bars is proportional to the number of elements. The difference is that each bar of a histogram represents the number of data elements in a range of values, such as the number of people who weigh from 100 pounds up to, but not including, 120 pounds. Each range of values should have the same width.
 -
Bar graph
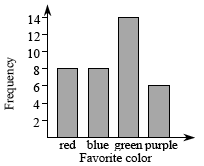 A bar graph is a set of rectangular bars that have height proportional to the number of data elements in each category. Each bar stands for all of the elements in a single distinguishable category (such as “red”). Usually all of the bars are the same width and separated from each other.
 -
Venn Diagram
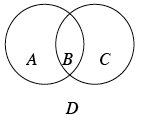 A type of diagram used to classify objects that is usually composed of two or more overlapping circles representing different condition. An item is placed or represented in the Venn diagram in the appropriate position based on the conditions that the item meets. In the example of the Venn diagram below, if an object meets one of two conditions, then the object is placed in region A or C but outside region B. If an object meets both conditions, then the object is placed in the intersection (B) of both circles. If an object does not meet either condition, then the object is placed outside of both circles (region D).
 -
Stem and leaf plot
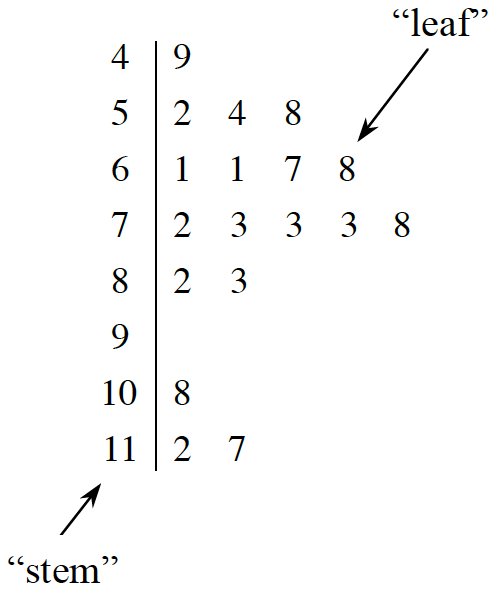 A frequency distribution that arranges data so that all digits except the last digit in each piece of data are in the stem, the last digit of each piece of data are the leaves, and both stems and leaves are arranged in order from least to greatest. The example at right displays the data: 49, 52, 54, 58, 61, 61, 67, 68, 72, 73, 73, 73, 78, 82, 83, 108, 112, and 117.

