 Hallie Young
-
Weather vs Climate
Weather
• Atmospheric changes with short timescales of days to a few weeks referred to as weather
• Limited predictability
Climate:
• Atmospheric changes with long timescales of months or more referred to as climate
• Potentially predictable
• averages of weather over time
-
What is climate change?
continuous deviation from established average
-
spheres of earth
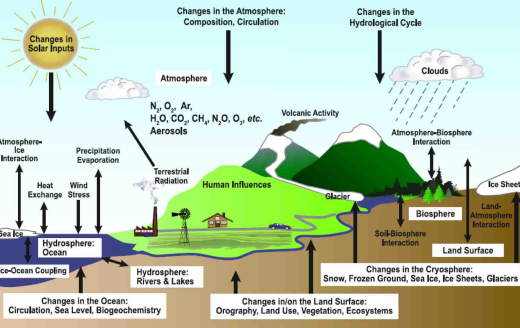
atmosphere-air
hydrosphere-ocean
cryosphere-frozen
lithosphere-rock
biosphere-life
constantly exchanging energy, momentum, matter (carbon and water)
water is very important
-
sun's energy
radiative forcing: imbalance between Earth’s incoming and outgoing radiation
measured at top of atmosphere
48% absorbed at surface
23% absorbed in atmosphere
29% reflected off atmosphere
incoming solar radiation (340 w/m2)
-
solar constant
The solar constant is the average intensity of the Sun’s radiation at a distance of 1 astronomical unit (the average distance of the Earth from the Sun).
1,361 watts per square metre (W/m2).
In fact, the Sun can be directly overhead only in the tropics. As shown below, when the Sun is lower in the sky, the intensity of the solar radiation is reduced because its rays are spread out over a larger area and because they must pass through more atmosphere before they hit the ground. At night when the Sun is below the horizon the solar intensity is clearly zero.
If we average out over an entire 24 hour cycle the amount of solar radiation hitting the Earth’s surface (known as the solar irradiance) on a clear day at the equator on the equinox is approximately 340 W/m2.
-
Feedback Loops
positive: amplify (ice albedo)(affects arctic north the most)
negative: deamplify (silicate rock weathering draws down co2 from atmosphere)
-
temperature anomalies
better for comparing different regions over time
shows deviation from established baseline
get rid of uncertainties that appear in plain temp measurements
we are about 1C from baseline
30 year motzart at least
-
Arctic Amplification
high altitudes warming faster
sea ice melt (every summer a lot melts and refreezes in the winter)
each year more and more is melting over the summer and some not refreezing
accelerated ice loss, declining ice mass
melting permafrost releases methane (bacteria releasing, more greenhouse gasses, organix material uncovered and decomposing->co2 also)
lack of continent in north arctic->less reflectivity so heating more than antarctic ice albedo
sea ice minimum decreasing (younger+thinner)
age decreasing
snow covering decreasing
-
sea level
sattelite altimeter: exact level/location
tide gauge: comparitive tide and land, may be misleading
has been rising since at least 1880 (about 210-240 mm) (21-24 cm)
rate of sea level rise past 2-3 decades (3.4± mm/year)
thermal expansion, hotter water larger space (OHC has been increasing)
glaciers and ice sheets melting into water
NOT CAUSED BY SEA ICE (volume already in water)
causes: thermal expansion (40%), Greenland ice sheet (21%), glaciers etc
greenland ice sheet: if melt: 7m increase
antarctic: 60m
west antarctic: 6m(The warming Southern Ocean is flowing under the WAIS, so it's melting and losing mass)
-
Heatwave trends
increasing in:
frequency
intensity
length
season length
-
precipitation trends
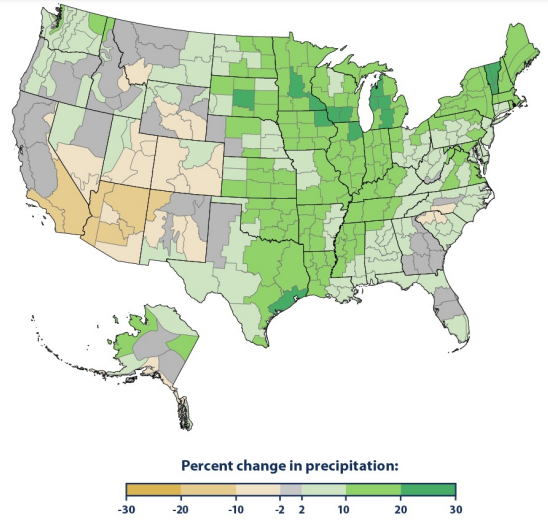
dry drier, wet wetter
intenser rainfall and increased flooding
central/east america (Esp northeast) precipitation increase
west (southwest) drier
-
sun energy
~15 k: core
~6,000 k: surface
total solar irradience (TSI) at top of earth's atmosphere: 1,360 w/m2 (solar constant)
solar irradiance average for a region over 24 hrs: 340 w/m2
-
sunspots
dark spots on the surface of the sun
magnetic disturbances/magnetic fields on surfaces
cooler areas of the photosphere
surrounded by bright spots (facculae) (can lead to solar flares)
solar flares near sunspots
therefore->more sunspots is brighter
affect TSI in 11 year cycles (increase TSI when more sunspots)
+/- .01% change
last few cycles have been decreasing schwabe
-
milankovich cycles
orbital parameters/cycles
eccentricity: shape of earth's orbit around sun (100,000 yr cycles) o O 0
obliquity: The angle Earth's axis of rotation is tilted as it travels around the Sun. tilt of earth on axis (NOW: 23.5. varies 22-24.5o) 40,000 yr cycle
precession: position on axis As Earth rotates, it wobbles slightly upon its axis, like a slightly off-center spinning toy top. ~23,000 yr cycle. direction that axis points
caused by gravitational forces
do not explain climate change because would indicate cooling trend
-
atmospheric composition and GHG
atmospheric composition:
nitrogen: 78%
oxygen: 20.9%
argon: 1%
GHG: <.1%
carbon dioxide CO2 .0407%
current spx co2: 420 ppm
anthropogenic carbon emissions: 10 gigatons/yr
water vapor
methane
nitrous oxide
ozone O3 lower atmosphere=greenhouse gas
biomass burning, car exhaust, interfere w/stratosphere
in stratosphere
protects earth from UV light
Chlorofluorocarbons CHC plastic, break down and thin ozone (hole inozone-> cooling)
halocarbons
chlorofluorocarbons
-
radiation spectrum
shorter wavelengths mean more power, because more ocncentrated, has to travel less far distance
most of suns energy comes in the form of visible spectrum
infrared (long) - ultraviolet (short)
less than 400nm is utraviolet
over ~720 nm infrared
Top of atmosphere receive most energy (visible), sea level mostly infrared and less
receive more at equator->hotter
-
radiation distribution
incoming sunlight gives each overall region same sun, but some of it is at a direct angle (equator) and some are not. These indirect angles are spreading the radiation over a much larger area, so the region is less warm as a result.
having to spread more: high latitudes
water vapor absorbs the most
48% sun radiation absorved by surface
29% reflected at the top of the stmosphere
23% reflected by clouds and atmosphere
7% reflected by surgace
surface radiation from earth 117%, back radiation from greenhouse gases 100%, atmospheric window 12% (approximately at wavelengths of infrared radiation between 8 and 14 micrometres.)
-
greenhouse effect
intercept 90% of outgoing heat
solar radiation enters easily but has a hard time exiting because of greenhouse gases so rereadiated heat and more heat trapped in atmosphere and less escapes into space
earth reemits heat/energy: infrared radiation
non-GHG do not absorb infrared radiation, which is why it can pass to bottom of atmosphere.
A molecule can only absorb IR radiation if it experiences a change in dipole moment during a vibration, like stretching or bending
that outgoing infrared absorbed by ghg and emitted in all directions (like back to earth)
-
carbon sinks and carbon
ocean the biggest carbon pool (DIC dissolved inorganic Carbon) (vertical transfer biologic pump the phytoplankton eaten and creatures droppings sink)
Examples of rapid carbon fluxes in the Earth system
Gas exchange between atmosphere and ocean
photosynthesis/respiration
(also there are slower/longer-term fluxes like weathering of rocks, limestone formation, etc)
Sources of anthropogenic carbon
Fossil fuels, Land use changes
(we add 10 gigatons to atmosphere each year)
isotopic data indicate anthropogenic carbon sources
causing ocean acidification
-
climate system
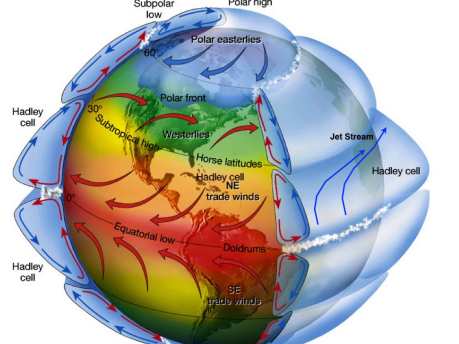
High latitudes receive less intense radiation than low (equator)
High latitudes emit more heat than they absorb and low latitudes absorb more heat than they emit. (~40o lat the in/out about same)
heat transport(meridional)(keep tropics from too hot etc)
https://youtu.be/oZ6exQoU_CM
3 convection cells per hemisphere
Coriolis effect: the earth is constantly rotating, like a merry go round. Appears “deflected” due to rotation
Wind is air going from higher to lowe r pressure
Air rising from equator to top of troposphere, sinks down around 30*
Going from lower to higher latitude sink about 30 rise about 60,
Horse latitudes 30, doldrums around equator
-
ekman transport
https://youtu.be/KBKmKI3tl4Q
wind friction on the surface current, moves
wind blows and eachlayer of water friction to move the next layer down gradually lose power but because coriolis slightly to the right each time ekman spiral so when the water moves it is roughly 90 angle from the wind original dirction (on average) (the NET transfer)
-
gulf stream vs antarctic circumpolar current
gulf stream:
actually a current., very powerful
speed: 1ms^-1
transport up to 100 sverdrups
helps brings heat to europe
antarctic circumpolar current:
strongest current (>100sv !)
eastward flow around antarctica
p[en passage, land not there to get in the way
deep water mixed to surface
-
thermohaline circulation
Moves water around and up and down density moves it around atlantic lower to higher latitudes denser water cooler + salinity greact ocean conveyor. Water come back to surface upwellig when water freezes leaves salt in non frozen water makes that non frozen water more salty "great ocean conveyor"
thermo=temperature, haline=salinity
The densest deep water mass is formed in the Weddell Sea of Antarctica, and becomes the Antarctic Bottom Water (AABW). Similar processes in the North Atlantic produce the North Atlantic Deep Water (NADW) in the Greenland Sea
Thermohaline circulation (properly described as meridional overturning circulation) of the world's oceans involves the flow of warm surface waters from the southern hemisphere into the North Atlantic.
-
la nina, el nino, normal conditions
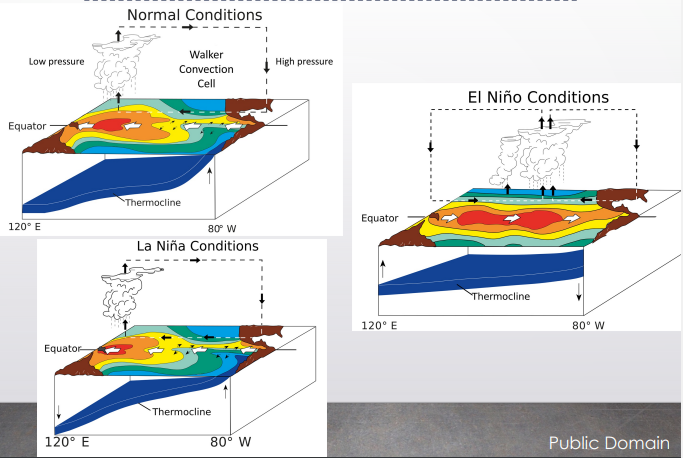
ENSO (el nino southern oscillation)
ocean and atmospheric change
Occurs every 3-7 years-Lasts 9-12 months
Trade winds weaken, slacken
This means heat spreads eastward, no coastal upwelling, nutrient rich col water doesnt surface-bad fishing
Evaporation in central pacific, flooding to southern us, droughts to west us
La nina is like el nino but the opposite:normal to extreme degree, strong trade winds, cooler temp in eastern pacific, wet west pacific, usually follows strong el nino
La nina: cold north us, wet northwest, dry south, warm east. push jet stream up
El nino: wet southwest dry southeast warm noth
-
fractionated oxygen
vapor enriched in O16 (lighter) meaning that oceans relatively more 18O
( polar precipitation (the air carried from equator evaporation) relatively 18O depleted)
less 18O in atmosphere as it gets colder (more enrich 18O ocean indicates more ice)
Oxygen 16
8 protons, 8 neutrons, Most abundant: 99.98%
O18
8 protons 10 neutrons .02%
o 17 least abundant wiith <.01%
-
fractionated carbon
12C is fractionated into living tissue.
liiving prefers lighter c12
– Carbonate shells reflect changing 12C/13C of seawater
-
ice core paleoclimate proxies
annual snow layers turn into ice
annual to centennial resolution (up to 800,000)
high resolution, doesn't stretch as far back
precipitation can be estimated from layer thickness
temperature from oxygen isotopes
co2 from trapped ait
dust measure of wind velocity + direcition local erosion
-
sediment cores
retrieved from drill chips
longer resolution (up to 180 million years)
changes in sedmient composition/chemistry can indicare environmental change
microfossil species indicators of environmental change
isotopic changges in pelagic or benthic fossils as proxies of paleotemperature and productivity
benthic foraminifera are marine amoebas that make fossilizable shells of calcite or cemented sediment grains.
Pelagic sediment or pelagite is a fine-grained sediment that accumulates as the result of the settling of particles to the floor of the open ocean, far from land
-
end permian
Hothouse climates, one of the big five mass extinction events
biggest extinction event in earths history
95% marine species extinct
70% land vertebrates exctinct
252 mya
Extremely hot biggest mass extinction in earth’s history
hot and dry
pangea and panthalassa
Heat+low oxygen (plant proxy ind)
Impact dep within earth, vertical movements of rock plates in crust (this is more likely in supercontinents), panagea surrounded by deep trench, plates drop, magma to surface,
siberian trap basalt erupt
Relatively short timescale for eruption
Methane hydrate trapped in ice melt from heat
released c12 into ocean +atmosphere,
heat up ocean.
No deep ocean ventilation, anoxic
Ocean chemistry change
-
PETM (Paleocene-eocene thermal maximum)
56 mya
best analog of modern climate change
spikes in co2 (2000-3000 gigatons input)
relatively short period (10-20,000yrs)
temperature spikes (5-8c global warming)
proof:
soil color, dry western US, alligator and palm tree fossils in arctic areas
Ocean acidification: calcium carbonate depth shallower (~2m). extinct foraminifera
c12 enriched
hypotheses: methane hydrate melting
earliest true primates develop
-
last 50 million years of climate change
hot house to ice house
sea level fall
temp fall
co2 fall
mountains rise
ice sheets grow
sea floor spread slowing down
Miocene (23 mya): ice growth Antarctica + greenland
continental collisions
Opening drake passage (between south America and Antarctica) through tectonics
isolates Antarctica-> antarctic circumpolar current->colder->more ice
pliocene (5.3 mya): closing isthmys of Panama,
great American interchange. land bridge created for animals/species cross
enhancement gulf stream, more to higher latitudes ice build up
east African rift->hominids
himalayas rise change wind directions
quaternary period
Last 2.7 million years
Add an antrhopocene to say how much humans have changed enviro?
pleistocene and holocene
-
pleistocene epoch (2.6 mya-11,700 ya)
RAPID climate change-ice age
global temperatures reached ~5.6C lower than it is today
sea level was about 100-130 meters lower that it is today during glacial stages
co2 was ~200 ppm (half current concentration)
eurasian ice sheet
up to 3km thick ice. sea level 100-130m lower than today
cooling trend (more land->albedo)
-
last 8000 years
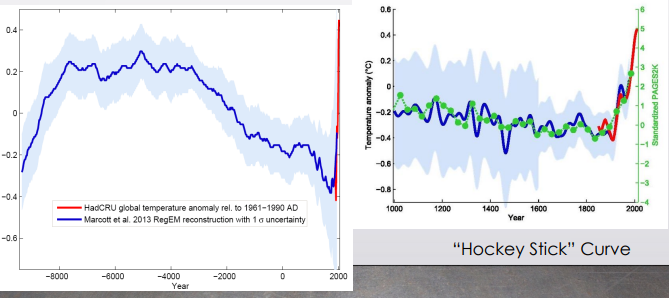
cooling trend over past 8000 years in accordance with parameters
recent temperature increase has reversed this trend
co2 concentration atmosphere was relatively constant (280 ppm) until industrial revolution
HOCKEY STICK curve
9-13th century medeival warm period: higher solar activity, solar intensity
16-19th century: little ice age. explosions-> particles in atmosphere, dimming effect
Both these are only plus or minus .02c ish
-
different SSP (shared socioeconomic pathways)
5 (8.5)
3 (7.0)
2 (4.5)
1 (2.6)
1 (1.9)
scenarios start in 2015
2nd number radiative forcing/Wm2 in 2100
-
precipitation changes
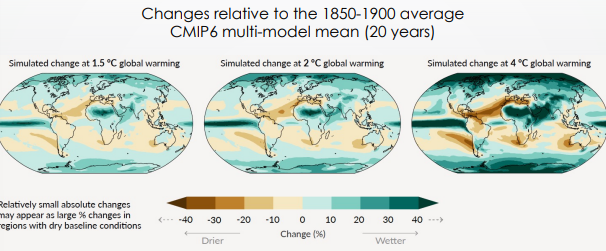
Precipitation increase at high latitudes, equatorial Pacific, and monsoon regions
• Decrease in subtropical areas
-
ocean acidification changes , sea levle
The more co2, the more in the atmosphere as relative to land and ocean because the land and ocean carbon sinks reach capacity for carbon absorption
all scenarios decreased sea ice
Both ssp1 conditions stabilize a little above/below 8.0 ph by 2100
Ssp5 less than 7.7 ph
sea level:
High level of uncertainty
Might have crossed threshoholds. Hard to account for, ice shelves can break off, west antarctica melting faster than predicted
Ssp1 about .5m
Ssp5 about 1m (low likelihood high impact scenario to 1.75 m)
-
projected hot temperature extreme changes
10 year event 50 year event
No region with decrease in hot weather extremes since 1950
Many hot weather regions confident it is anthropogenic
Pretty much everywhere getting hotter
We’re already at about ~1.0c 1.2c hotter 28 times more likely
Extreme events: x-year events, happen every x years on average. When just 1.2c hotter, 10 year event 2.8 times more likely to occur! Frequency increase and intensity increase. Bith will happen more and be more extreme when occur
-
precipitation trends
Hot places getting hotter, wetter wetter, dry drier
hot extremes: western us
drought: north(???) western us
precipitation: eastern/northern us
-
ocean acidification
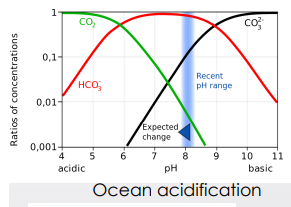
Rising temperature->coral bleaching. Colored symbiotic zooxanthellae are expelled from coral polyps. Can mean coral dies because eject zoo at certain temp threshold
As more carbon enters the ocean, it chemically changes ocean composition and makes it more difficult for calcifying organisms (like crustaceans, corals, etc) to make their calcified shells or secrete calcium carbonate (caco3). Also makes it more likely for this carbonate to dissolve. This hurts not only the animals who need it, but the larger ecosystem that feeds on these smaller organisms
-
at risk population
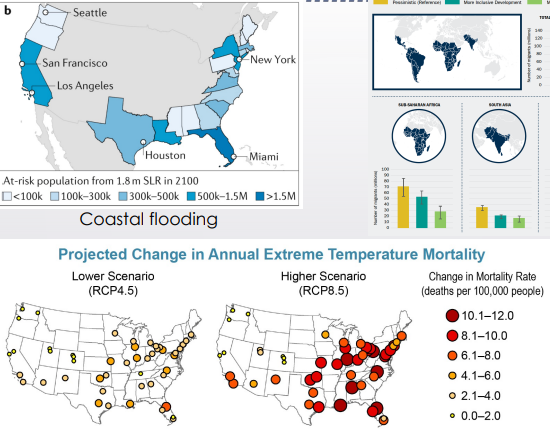
coastal flooding (protect or accomodare or retreat) (houston, miami, new york, san francisco, los angeles)
temperature mortality rate increasing
climate migration (up to 1 billion people by 2050)
weather fatalities, spread of diseases (malaria, zika), increases in respiratory illness (increased air pollution) (prolonged pollen season). lack of water supply from melting glaciers (outburts floods, ice avalanches), excessive erosion
-
jet stream
caused by different air pressures, warm air masses less dense cold more dense. Pressure gradient from high to low pressure, so this air moves from high pressure to lower pressure areas and is fiverted because of the coriolis effect
polar jet stream dominates mid latitude weather
relatively narrow bands of strong wind in the upper levels of the atmosphere.
Polar jet stream dominates mid-latitude weather: Fast upper-level winds form at boundary between cold dense polar air and warm moist subtropical air
-
The Inter-Tropical Convergence Zone (ITCZ - pronounced "itch")
appears as a band of clouds consisting of showers, with occasional thunderstorms, that encircles the globe near the equator. The solid band of clouds may extend for many hundreds of miles and is sometimes broken into smaller line segments.
-
gyres
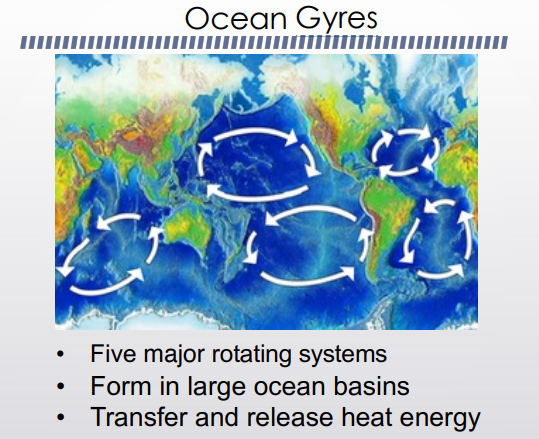
Piling up water into center, as water tries to flow outwards drifts to write and contributes to the gyre
WEST: low->high (bring heat)
EAST: high ->low (btungs colder)
2 clockwise north, 3 counter clockwise south
-
tropical divergence/ upwelling
affect phytoplankton and nutrient availabilty
currents and deep ocean layers set into motion
like "gap" opening up at equator because trade winds push water and ekman transport mean 90 degrees away so a bunch of that top, warm water is pushed away and colder, nutrient rich water at the surface
leads to phytoplankton growth because more clorophyl in this water
-
nao pdo and amo
North Atlantic Oscillaiton:
sea-level pressure difference between two pressure points across north atlantic (differences in how big the difference is)
can change position of jet stream
positive: large difference in pressure, wild westeries, mild air from atlantic leading to mild and stormy winter uk
negative: weaker jet stream, cold and dry, easterly (blocking)
pacific decadal oscillaion:
like ENSO but much longer timescale (20-30 yrs)
atlantic multidecadal oscillation:
sea surface temp anomaly oscillation north atlantic
estimated 60-80 yrs
potential link to hurricane freq??? controversial???
-
ice core vs sediment core proxies
Ice Cores
Go back up to ~800,000 years
Really good resolution
(about 400,000 yrs is where good resolution ends. Further down damaged)
Yearly layers so climate info
Can find co2 and oxygen isotopes trapped inside as well
Dust also found inside and can help estimate wind velocity
Sediment Cores
Go back further than ice cores, up to ~180 million years
Poor resolution,
sediment gathers little and slowly
Microfossil species, shell composition, colors
Isotopic changes in pelagic or benthic fossils can show co2 levels and rough temp
-
pleistocene to holocene
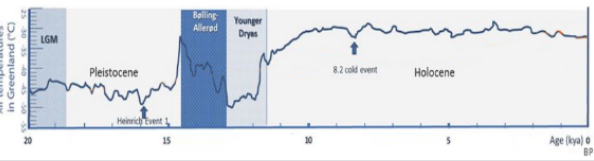
pleistocene
2.58 million years ago - 0.012 million years ago
Bølling-Allerød
rapid warming, changing orbital parameters
Younger Dryas event
About 14,500 years ago,
Earth's climates shift from a cold glacial world to a warmer interglacial state. Partway through this transition, temperatures in the Northern Hemisphere suddenly returned to near-glacial conditions.
holocene
(last 11,700 yrs)
Cooling trend over past ~8000 years in accordance with orbital parameters
Recent temp increase has reversed this trend
Co2 concentration constant on average (260-280 ppm) w/industrial revolution
-
climate models
Global circulation model (GCM)
Subdivide the earth into grids to predict what will happen
mass, momentum, energy, and pressure
Fundamental laws of physics (motions, thermodynamics) applied
Timesteps: can’t go all at once, need to calculate on slower timescale to account for changes and movement between squares
What is a typical grid resolution?
~2°
20-30 layers in atmosphere and ocean
What kinds of boundary conditions are needed?
fixed & variable.
Fixed: typography of ocean, solar radiation constant, orbital parameters
Variable: land use, GHG,
How model evaluated?
Compare results with specific variables to the observed actual changes/each other
-
ssp temperature predictions
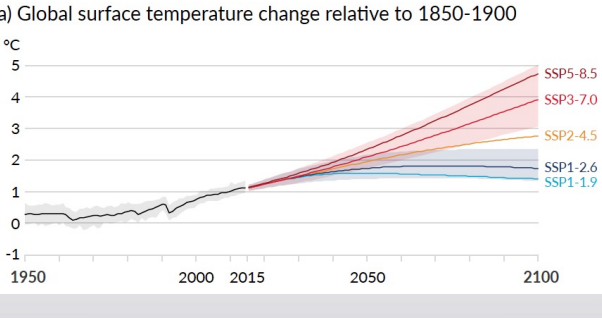
SSP1-1.9: about 1-1.5C
SSP1-2.6: 1.9-2.5
SSP2-4.5: 3
SSP3-7.0: 3.5
SSP5-8.5: about 4.4C by 2081-2100
Land warms more than oceans. High lat warm mote than low latitudes
MIP multimodal mean 20 years relative to 1850-1900
-
biome shifts
Prediction of poleward shift of biomes; biomes move further and further upward
Tundra will be replaced with taiga
Species in higher latitudes now might be replaced by lower lat species later as they move up
Overall greening but also increase in respiration

