 Fatima Adam
Genetics of Common Disease (Genomics)
Genetics of Common Disease This session will be delivered by Dr Roddy Walsh, who will outline some real-life examples of using genome-wide association studies to identify risk variants for common complex disease. Before the live lecture, test your understanding of some important concepts in human genomics by answering the four questions below. Learning Outcomes On successful completion of the lecture, students should be able to: Describe the difference between rare monogenic disease and common polygenic disease Describe the key differences between the genetic variation leading to monogenic disease compared to the genetic variation leading to common disease Describe how we measure the contribution of genetics to a disease using twin studies as an example Describe the basic concepts underlying a genome-wide association study (GWAS) Describe how a GWAS can be used to identify genetic variants associated with common disease
-
What is a characteristic of monogenic diseases regarding the environment? (1)
Environment is not essential in causing the disease.
-
How many genes are typically involved in monogenic diseases? (1)
Single gene (variant) is responsible for the disease risk in families, though multiple genes can be associated with the condition.
-
How common are monogenic diseases? (1)
Rare, occurring in less than 0.05% of the population.
-
What are the inheritance patterns for monogenic diseases? (2)
Clear inheritance patterns such as:
Autosomal dominant
Autosomal recessive
X-linked, etc.
-
What plays a major role in common/complex genetic diseases? (1)
Environmental and clinical co-morbidities, such as smoking, obesity, and diet.
-
How do common/complex diseases result from genetic variation? (1)
Variants in many genes combine to determine risk in individuals, making them polygenic.
-
How common are common/complex genetic diseases? (1)
They are much more common than monogenic diseases.
-
Is there a clear inheritance pattern for common/complex genetic diseases? (1)
No clear inheritance pattern.
-
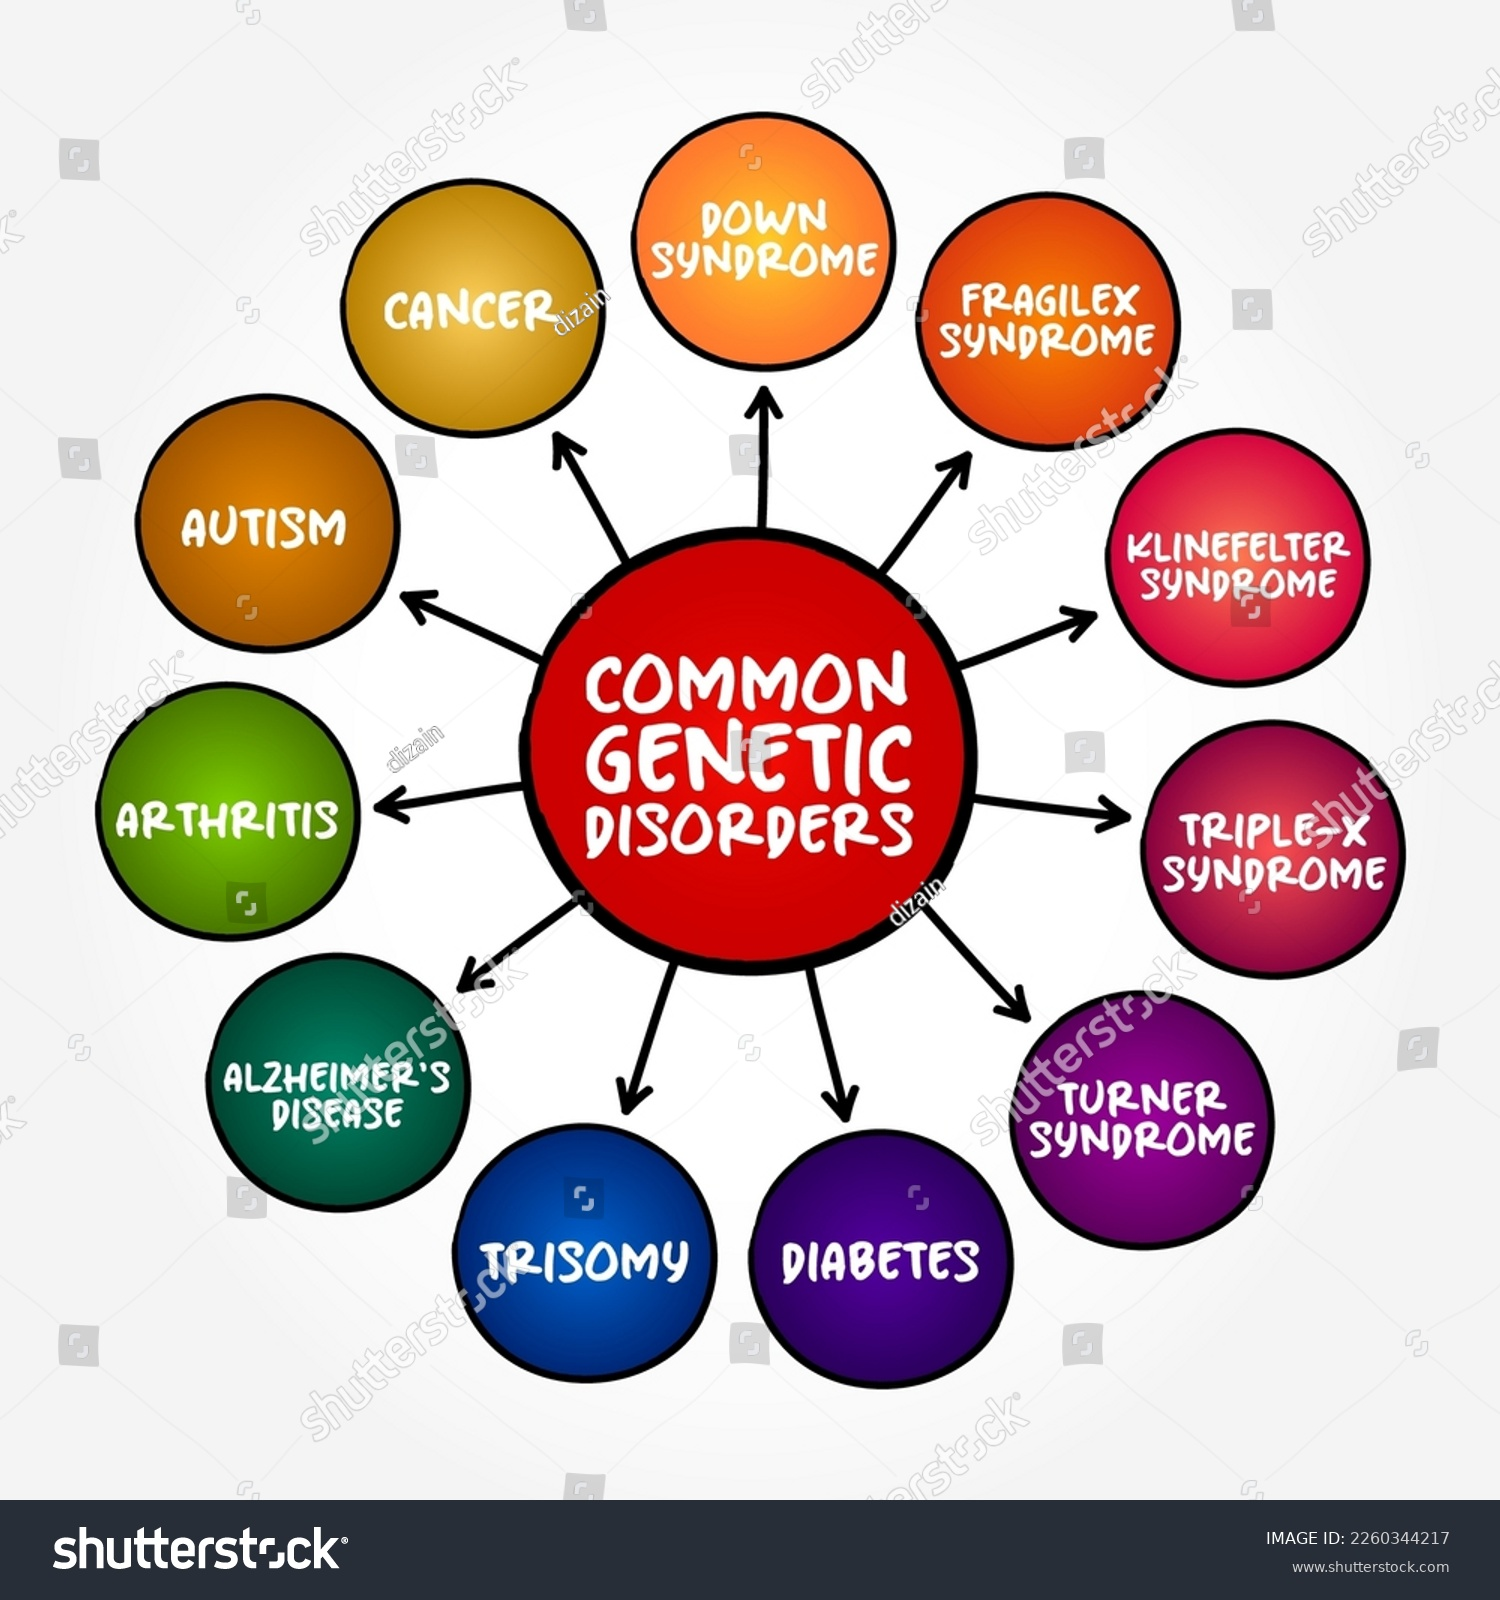
Name two examples of common/complex genetic diseases. (2)
Stroke
Schizophrenia
-
Which is NOT a complex disease? (2)
Duchenne Muscular Dystrophy (Purely genetic)Mesothelioma (Purely environmental)
-
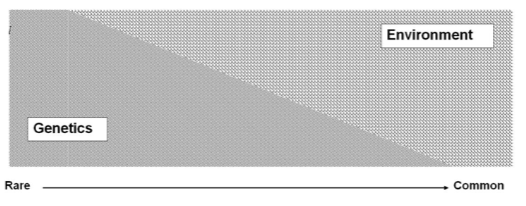
What is the relationship between genetic and environmental risk factors in disease? (1)

There is a spectrum of genetic vs. environmental risk factors, not discrete categories.
-
Can there be different forms of the same disease or clinical condition? (1)

Yes, there can be different forms of the same disease or condition, influenced by both genetic and environmental factors.
-
Is hypertrophic cardiomyopathy always a monogenic disease? (1)
No, more than 50% of cases have no monogenic cause.
-
Can common complex diseases have monogenic forms? (1)

Yes, even complex diseases like coronary artery disease may have rare monogenic forms.
-
How do twin studies help us understand genetic vs environmental factors in disease? (1)
Twin studies compare the frequency of identical twins having the same trait/disease with that in non-identical twins.
-
How do identical and non-identical twins differ in a twin study? (2)
Identical twins have the same genomes and similar environments.
Non-identical twins have different genomes but share similar environments (like siblings).
-
What does it suggest if a disease is more common in identical twins than non-identical twins? (1)
If the trait/disease is higher in identical twins, it suggests a genetic effect.
-
What does it suggest if the disease frequency is the same in both types of twins? (1)
If the frequency is the same, it suggests environmental effects are more important
-
What other method can estimate genetic heritability? (1)
Genome-wide association studies (GWAS) can now estimate genetic heritability.
-
What is genetic association? (1)
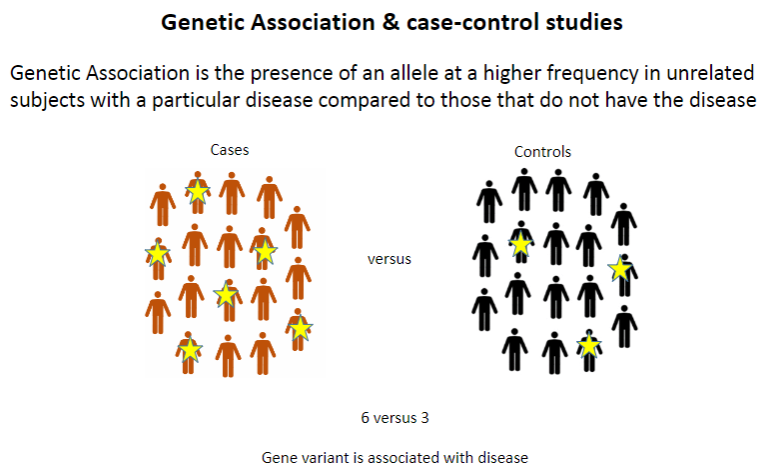
Genetic association refers to the presence of an allele at a higher frequency in unrelated individuals with a particular disease compared to those without the disease.
-
What is the typical design of a case-control study? (1)
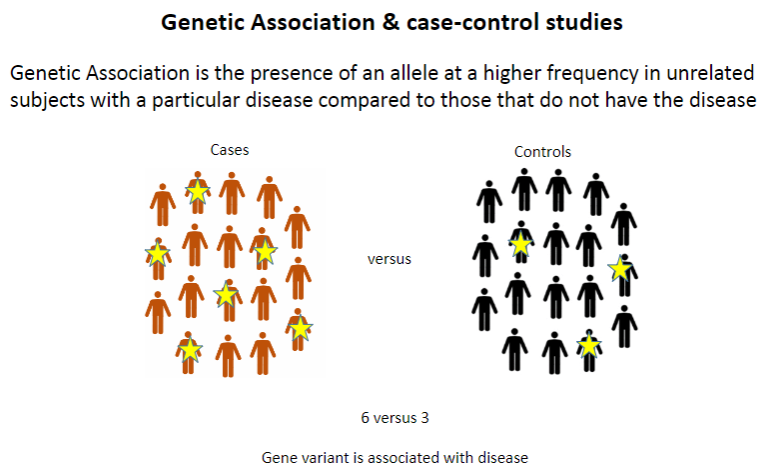
Case-control studies compare individuals with a disease (cases) to those without it (controls) to identify genetic differences between the groups.
-
What is linkage disequilibrium? (1)
Linkage disequilibrium occurs when genetic marker alleles that are close to a disease-causing allele on the same chromosome are more likely to be inherited together.
-
Why are alleles close to a disease-causing allele more likely to be inherited together? (1)
Close alleles are more likely to be inherited together because they are physically close on the chromosome and less likely to be separated by recombination.
-
What is the typical distance between marker alleles and disease-causing alleles that can be detected in population-based studies? (1)
Marker alleles that are typically within 100kb of a disease-causing allele can be detected in population-based studies, compared to >10Mb in linkage studies.
-
Why are recombination events more likely to occur in population-based studies than in linkage studies? (1)
In population-based studies, recombination can happen in various regions of the chromosome across different individuals, increasing its likelihood. In linkage studies, recombination is less frequent because the focus is on specific regions within families, limiting the variability in recombination events.
-
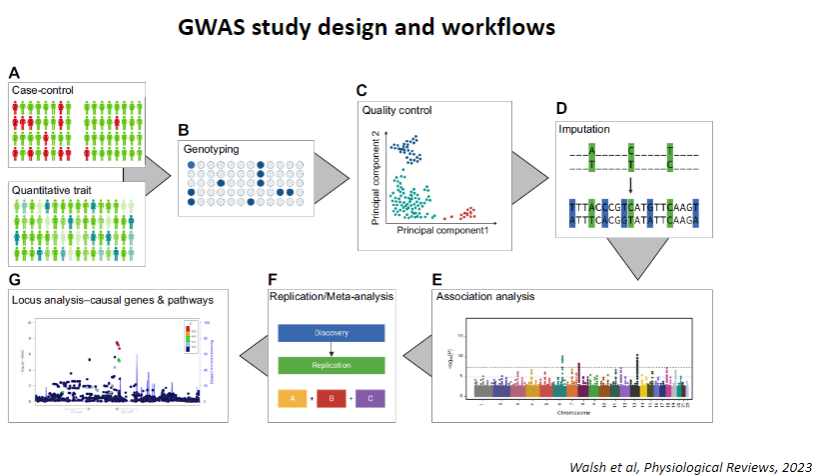
What are the key requirements for a successful GWAS case-control study? (3)
Large numbers of well-defined cases and controls
Cases and controls should be matched as closely as possible, especially for ancestry
Reliable and cost-effective genotyping technology, such as SNP microarrays
-
Why is it important to have matching cases and controls in a GWAS study? (1)
Matching cases and controls, particularly for ancestry, helps reduce confounding factors that could distort genetic associations.
-
What technology is typically used for genotyping in GWAS studies? (1)
SNP microarrays are commonly used due to their dense coverage and cost-effectiveness.
-
What quality control and statistical methods are important in GWAS studies? (2)
Standard quality control workflows should be applied to ensure accurate data.
Statistical analysis should include multiple testing correction due to the large number of independent loci (approx. 1 million).
-
Why is replication important in GWAS? (1)
Replication of positive associations in independent datasets helps confirm the validity and reliability of the findings.
-
Picture demonstrating GWAS study design and workflows:
-
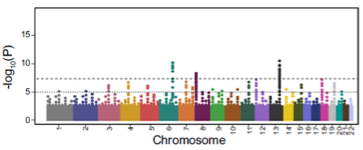
Picture demonstrating Results – Manhattan Plot:

-
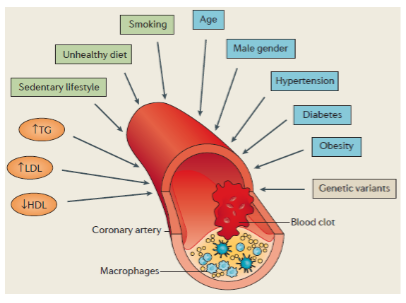
What is Coronary Artery Disease (CAD) and what causes it? (2)

CAD is caused by atherosclerosis (lipid deposition and inflammation) in blood vessels that supply the heart.
This can lead to myocardial infarction (MI) or heart attacks, a leading cause of death in the developed world.
-
What is the prevalence of CAD? (1)

CAD affects approximately 5% of individuals.
-
How do genetics contribute to CAD? (2)
Early family studies (1950s) indicated a heritable component.
Twin studies (1994) estimated the heritability of CAD at around 50%, and genome-wide approaches suggest 40-50% heritability.
-
Are there rare monogenic forms of CAD? (2)

Yes, familial hypercholesterolaemia (FH) is a rare monogenic form of CAD.
Mutations in LDLR, APOB, and PCSK9 can increase CAD risk by ~4-fold.
-
What is the overall genetic contribution to CAD? (2)

While rare monogenic forms exist, the majority of CAD cases are explained by polygenic (common variants) and environmental factors, making CAD a complex disease.
-
When was CAD first studied by GWAS? (1)
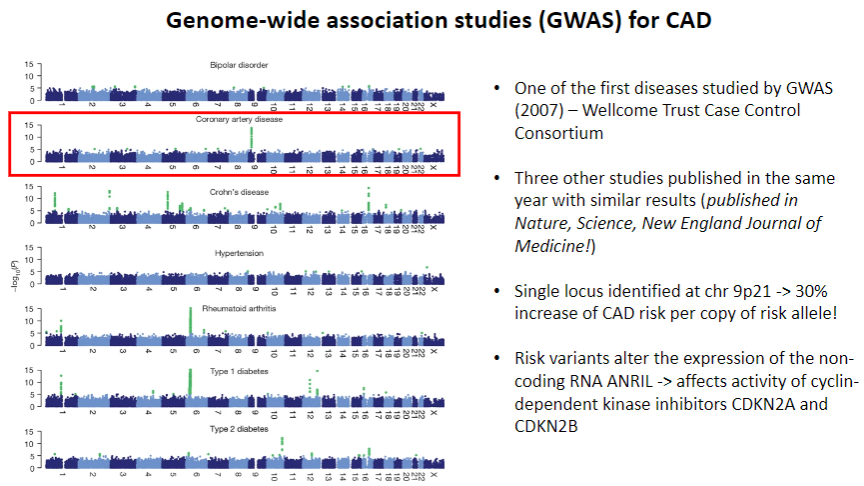
CAD was one of the first diseases studied by GWAS in 2007 by the Wellcome Trust Case Control Consortium.
-
What were the key findings from the 2007 CAD GWAS studies? (2)

Three other studies published the same year in Nature, Science, and New England Journal of Medicine showed similar results.
A single locus was identified on chr 9p21, associated with a 30% increase in CAD risk per copy of the risk allele.
-
How do the identified risk variants affect CAD risk? (2)

The risk variants at chr 9p21 alter the expression of the non-coding RNA ANRIL, which affects the activity of cyclin-dependent kinase inhibitors CDKN2A and CDKN2B.
-
How do you visualize GWAS results with ~400 significant loci? (1)

You don’t visualize them all directly, but you circularize the Manhattan Plot.
-
What is a Manhattan Plot? (1)
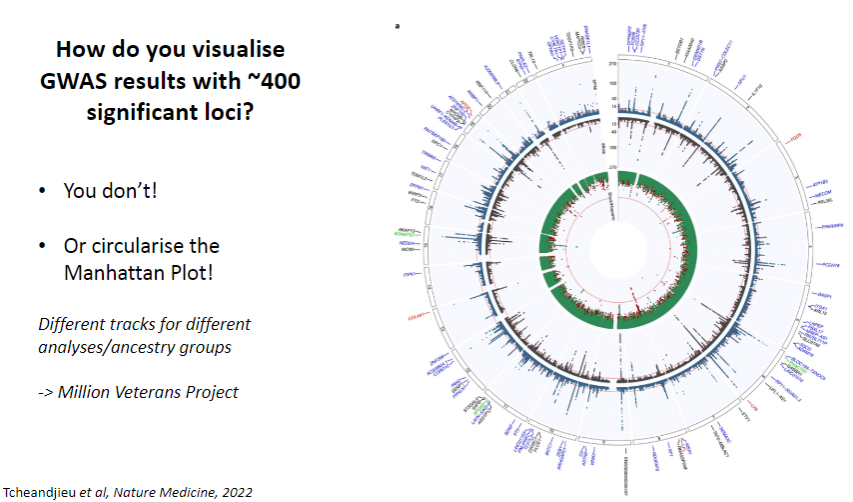
A Manhattan Plot displays genome-wide association results with each point representing a genetic variant. The x-axis is chromosome position, and the y-axis shows the significance (p-value) of association.
-
How are different analyses or ancestry groups represented in GWAS visualization? (1)

You can include different tracks for different analyses or ancestry groups to provide a more detailed view of the results.Example: Million Veterans Project dataset uses this approach.
-
What have very large case-control studies identified for Coronary Artery Disease (CAD)? (1)
These studies have identified numerous SNPs/loci associated with the risk of developing CAD.
-
How can we identify the risk variants an individual carries for CAD? (1)
By typing (identifying) the SNPs in a particular individual, we can determine which risk variants they carry.
-
How many risk variants for CAD does everyone carry? (1)
Common SNPs (~400 at genome-wide significance) means that everyone carries many risk variants for CAD.
-
What is a Polygenic Risk Score (PRS) or Polygenic Score (PGS)? (1)

A PRS/PGS is a quantitative assessment of an individual's genetic risk/predisposition to a disease by combining data for all identified risk variants.
-
What is the first step in deriving polygenic scores from GWAS datasets? (1)

Measurement of associated disease risk for every SNP or locus in the genome.
-
How is the number of risk alleles calculated for each individual in polygenic scoring? (2)

For each individual, calculate the number of risk alleles for each SNP.
This is weighted according to the effect size from GWAS summary statistics.
-
What SNPs are included in the polygenic score? (2)
Polygenic scores can include genome-wide significant SNPs that have strong evidence of association with the trait.
They can also include SNPs below the significance threshold, which are still associated with the trait but with weaker evidence, as long as these SNPs are independent (not in linkage disequilibrium with others).
-
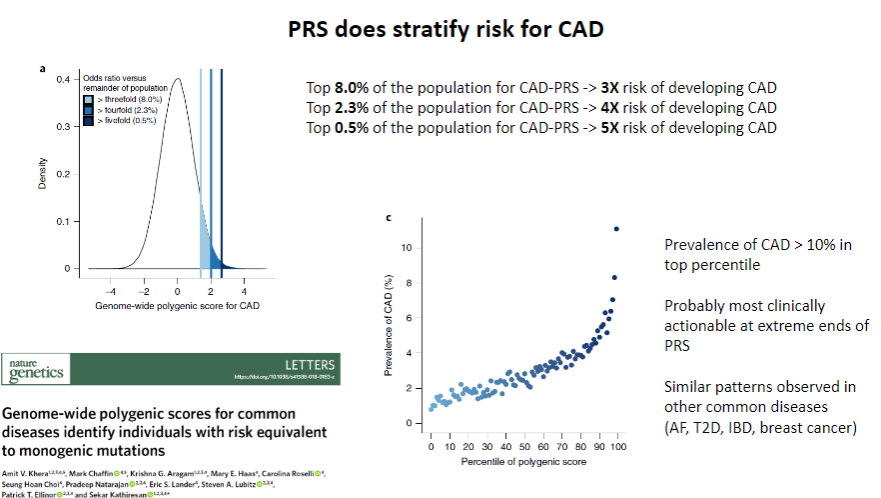
How is the population distribution for polygenic scores described? (1)

The population distribution of polygenic scores follows a normal distribution.
-
How can an individual's relative risk of disease be assessed from the polygenic score? (1)

By comparing an individual's polygenic score to the population distribution, we can assess their relative risk of the disease.
-
When can PRS (genetic predisposition) for CAD be measured? (1)
PRS can be measured from birth, unlike other CAD risk factors that develop over several decades.
-
How can PRS help with early identification of at-risk individuals? (1)
Early identification of individuals at high genetic risk for CAD enables early intervention before the disease develops.
-
How can interventions be guided by PRS for CAD? (2)
Statin therapy can reduce cholesterol levels and lower CAD risk.
Lifestyle interventions could be implemented if an individual is at high genetic risk.
-
Is measuring PRS for CAD economical? (1)
Yes, measuring PRS is relatively cheap, especially using SNP microarrays, and the same dataset can be used for PRS in other diseases (e.g., breast cancer, diabetes).
-
Does PRS stratify risk for CAD? (1)

Yes, PRS does stratify risk for CAD by identifying individuals at higher or lower genetic risk for developing the disease.
-
How does PRS contribute to CAD risk stratification? (1)
PRS uses genetic data from multiple SNPs to calculate an individual’s relative genetic risk, allowing for personalized risk assessment and more targeted interventions.
-
Does PRS provide predictive value above clinical risk factors for CAD? (1)
Yes, PRS provides independent predictive value above clinical risk factors by identifying genetic predisposition that is not captured by traditional clinical measures.
-
How does PRS enhance CAD risk prediction compared to clinical risk factors? (1)
While clinical risk factors like smoking, diabetes, BMI, and others are important, PRS adds genetic information that helps identify additional risk for CAD that may not be visible through clinical factors alone.
-
What is metaGRS (Genetic Risk Score) and how is it used in CAD prediction? (1)

metaGRS is a CAD Polygenic Risk Score (PRS) developed to predict the occurrence of CAD by using genetic information from a large dataset, like the UK Biobank.
-
How was metaGRS tested for its predictive value in CAD? (1)

metaGRS was tested by comparing its ability to predict CAD occurrence in individuals with clinical risk factors using data from the UK Biobank, allowing researchers to assess its effectiveness in improving prediction beyond clinical factors alone.
-
Does PRS work in the real world for predicting CAD? (1)

Yes, PRS has shown potential in predicting CAD risk in the real world by identifying individuals at high genetic risk even before clinical symptoms appear, enabling early intervention.
-
How is PRS applied in clinical settings for CAD? (1)
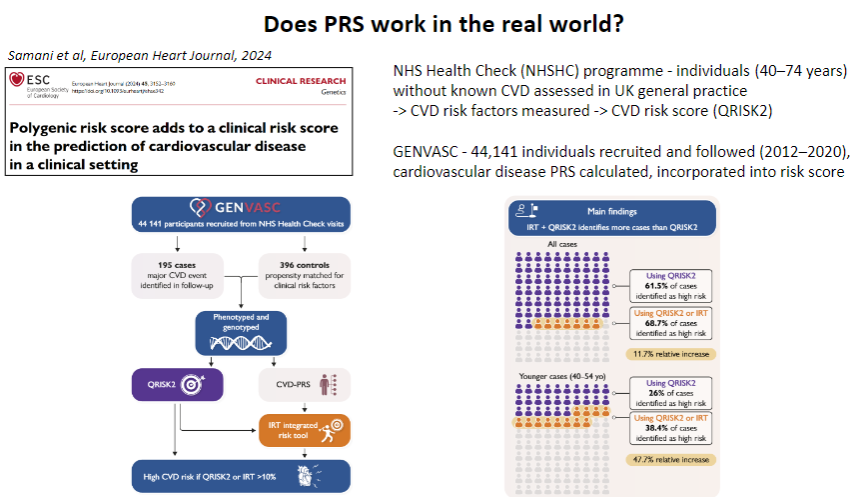
PRS can be integrated into clinical practice alongside traditional risk factors (e.g., smoking, hypertension) to offer more personalized risk stratification and guide preventive measures, such as lifestyle changes or statin therapy.
-
Does PRS work in the real world for predicting CAD? (1)
Yes, PRS has shown potential in predicting CAD risk in the real world by identifying individuals at high genetic risk even before clinical symptoms appear, enabling early intervention.
-
How is PRS applied in clinical settings for CAD? (1)
PRS can be integrated into clinical practice alongside traditional risk factors (e.g., smoking, hypertension) to offer more personalized risk stratification and guide preventive measures, such as lifestyle changes or statin therapy.
-
What are the challenges for adopting PRS in clinical practice? (4)
European ancestry bias: PRS is less effective for individuals of non-European ancestry due to limited representation in GWAS.
Standardization issues: Multiple PRS tools exist with different datasets and methodologies, creating inconsistency.
Cost and integration: While SNP arrays are inexpensive, setting up a program to use PRS in clinical practice is costly.
Education: Both healthcare professionals and patients need to be educated on the value of genetic risk to motivate behavioural changes.
-
How is PRS used to estimate genetic risk? (2)
PRS is derived from GWAS data, calculating the number of risk alleles for common genetic variants associated with diseases like CAD.
It provides a quantitative risk assessment, helping healthcare professionals assess disease predisposition and decide on preventive measures.
-
Can you think of any examples of environmental factors that may be associated with common disease? (2)
Diet: Poor dietary habits (high-fat, high-sugar diets) contribute to diseases like type 2 diabetes, heart disease, and obesity.
Air pollution: Long-term exposure to air pollutants is associated with respiratory diseases like asthma and cardiovascular diseases.
-
Do you know what we mean by the genetic term ‘penetrance’ with respect to disease? (2)
Penetrance refers to the proportion of individuals with a specific genetic variant who actually express the associated phenotype or disease. If a disease-causing mutation has 100% penetrance, every person with the mutation will develop the disease, whereas lower penetrance means not everyone with the mutation will show symptoms.
-
Can you identify which TWO of the following types of genetic variation are NOT likely to be associated with a monogenic disease that is lethal in early childhood? (2)(A) Rare missense variation
(B) Deletion in the DNA sequence that encodes a protein
(C) Rare single nucleotide variation in intergenic region of genome
(D) Common missense variation
(E) Change in the non-coding DNA that interferes with splicing
(F) Rare insertion in the DNA sequence that encodes a protein
(C) Rare single nucleotide variation in intergenic region of genome: Variations in intergenic regions are less likely to have a direct impact on a protein function, which is essential for monogenic diseases.
(D) Common missense variation: Common variants are generally less likely to cause severe, early-onset lethal diseases since they do not have a large impact on protein function.
-
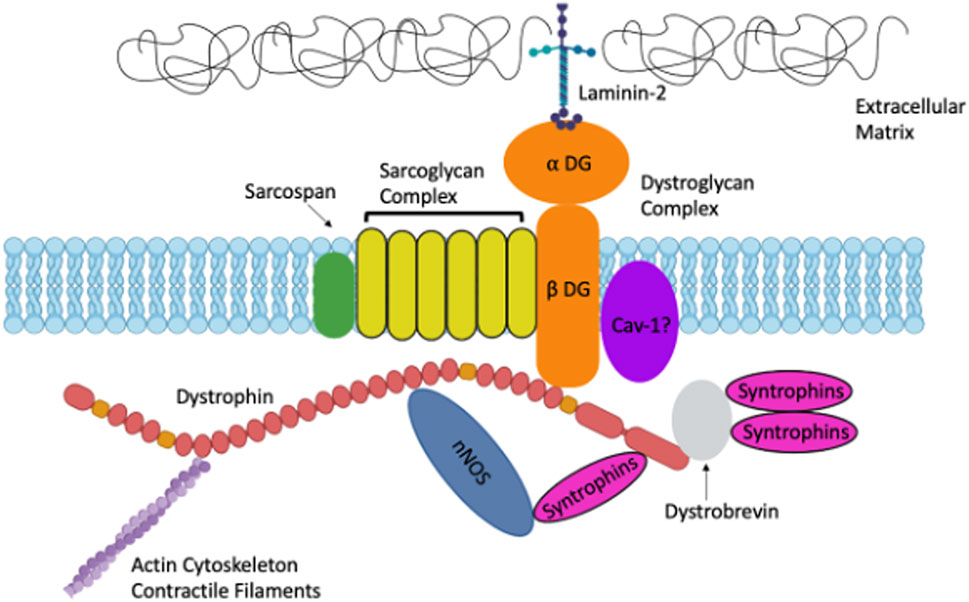
Researchers identify a missense variant in the gene that encodes dystrophin, and find that 30% of the European population have this variant. What statements can you make about the variant that are TRUE from the following list: (2)(A) It is a SNP
(B) It is likely to cause muscular dystrophy
(C) It results in a change in amino acid sequence
(D) It is a deletion
(E) It is a mutation
(A) It is a SNP: TRUE. A missense variant is a single nucleotide polymorphism (SNP), as it involves a change in one nucleotide, leading to an amino acid change.
(C) It results in a change in amino acid sequence: TRUE. A missense mutation changes one amino acid in the protein sequence.
Explanation for incorrect options:
(B) It is likely to cause muscular dystrophy: FALSE. Given that 30% of Europeans carry this variant, it is likely a common polymorphism, not a rare, disease-causing mutation.
(D) It is a deletion: FALSE. A missense variant is a single nucleotide change, not a deletion.
(E) It is a mutation: FALSE. While a missense variant is technically a mutation, it's a common polymorphism, not a rare variant associated with disease.

