 Drac
Drac-
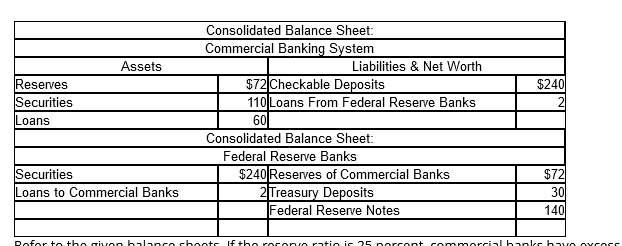
Refer to the given balance sheets. If the reserve ratio is 25 percent, commercial banks have excess reserves of
A. $12;
B. $24;
C. $22;
D. $16
A. $12
-
(Consider This) Credit card balances are
A. a component of M1.
B. a component of M1 but not of M2.
C. a component of M2 but not of M1.
D. not a component of M1 or M2.
D. not a component of M1 or M2.
-
A $20 bill is a
A. Treasury bill.
B. Federal Reserve note.
C. gold certificate.
D. Treasury note.
B) Federal Reserve note.
-
A major advantage of the built-in or automatic stabilizers is that they
A. simultaneously stabilize the economy and reduce the absolute size of the public debt.
B. automatically produce surpluses during recessions and deficits during inflations.
C. require no legislative action by Congress to be made effective.
D. guarantee that the federal budget will be balanced over the course of the business cycle.
C) require no legislative action by Congress to be made effective.
-
A tariff is
A. a tax imposed on imports.
B. any non-subsidy used to increase trade.
C. any non-tax action used to restrict trade.
D. a subsidy granted to imports. a tax imposed on exports.
A) a tax imposed on imports.
-
An appropriate fiscal policy for a severe recession is
A. a decrease in government spending.
B. appreciation of the dollar.
C. an increase in interest rates.
D. a decrease in tax rates.
D) a decrease in tax rates.
-
An economist who favors smaller government would recommend
A. tax cuts during recession and reductions in government spending during inflation.
B. increases in government spending during recession and tax increases during inflation.
C. tax cuts during recession and tax increases during inflation.
D. tax increases during recession and tax cuts during inflation.
A. tax cuts during recession and reductions in government spending during inflation.
-
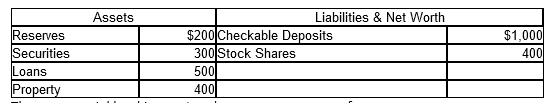
Answer the question on the basis of the given consolidated balance sheet of the commercial banking system. Assume that the reserve requirement is 20 percent. All figures are in billions.
The commercial banking system has excess reserves of
A. $2 billion
B. $5 billion
C. $10 billion
D. zero.
D. zero.
-
The monetary multiplier for the commercial banking system is
A. 10.
B. 20.
C. 15.
D. 5.
D. 5.
-
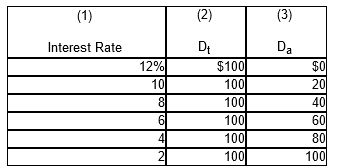
Answer the question on the basis of the table, in which columns (1) and (2) indicate the transactions demand (Dt) for money and columns (1) and (3) show the asset demand (Da) for money.The given data suggest that the amount of money demanded for transactions:
A. varies directly with the interest rate.
B. is independent of the interest rate.
C. varies inversely with nominal GDP.
D. varies inversely with the interest rate.
B. is independent of the interest rate.
-
Discretionary fiscal policy refers to:
A. the changes in taxes and transfers that occur as GDP changes.
B. intentional changes in taxes and government expenditures made by Congress to stabilize the economy.
C. any change in government spending or taxes that destabilizes the economy.
D. the authority that the president has to change personal income tax rates.
B. intentional changes in taxes and government expenditures made by Congress to stabilize the economy.
-
If nominal GDP is $600 billion and, on average, each dollar is spent three times per year, then the amount of money demanded for transactions purposes will be
A. $1,200 billion.
B. $200 billion.
C. $1,800 billion.
D. $600 billion.
B. $200 billion.
-
If supporters of restrictions on imports argue that protection is needed to preserve a strategic industry, they are using the:
A. infant-industry argument
B. save domestic jobs argument
C. protecting national culture argument
D. national security argument
E. dumping argument
D. national security argument
-
If the MPC in an economy is 0.8, government could shift the aggregate demand curve rightward by $100 billion by
A. increasing government spending by $25 billion.
B. decreasing taxes by $100 billion.
C. decreasing taxes by $25 billion.
D. increasing government spending by $80 billion.
C. decreasing taxes by $25 billion.
-
If the MPS in an economy is 0.1, government could shift the aggregate demand curve rightward by $40 billion by
A. increasing taxes by $4 billion.
B. increasing government spending by $40 billion.
C. increasing government spending by $4 billion.
D. decreasing taxes by $4 billion.
C. increasing government spending by $4 billion.
-
If you are estimating your total expenses for school next semester, you are using money primarily as:
A. a store of value.
B. an economic investment.
C. a unit of account.
D. a medium of exchange.
C. a unit of account.
-
If you place a part of your summer earnings in a savings account, you are using money primarily as a:
A. unit of account.
B. store of value.
C. standard of value.
D. medium of exchange.
B. store of value.
-
In terms of aggregate supply, a period in which nominal wages and other resource prices are unresponsive to price-level changes is called the:
A. long run.
B. immediate market period.
C. short run.
D. very long run.
C. short run.
-
In terms of aggregate supply, a period in which nominal wages and other resource prices are fully responsive to price-level changes is called the:
A. very long run.
B. immediate market period.
C. long run.
D. short run.
C. long run.
-
In the United States, the money supply (M1) includes:
A. coins, paper currency, checkable deposits, and credit balances with brokers.
B. coins, paper currency, and checkable deposits.
C. paper currency, coins, gold certificates, and time deposits.
D. currency, checkable deposits, and Series E bonds.
B. coins, paper currency, and checkable deposits.
-
In the extended analysis of aggregate supply, the short-run aggregate supply curve is:
A. horizontal and the long-run aggregate supply curve is upsloping.
B. horizontal and the long-run aggregate supply curve is vertical.
C. upsloping and the long-run aggregate supply curve is vertical.
D. vertical and the long-run aggregate supply curve is horizontal.
C. upsloping and the long-run aggregate supply curve is vertical.
-
In the long run,
A. there is an inflation-unemployment trade-off, and the terms of that trade-off have worsened in recent years.
B. there is an inflation-unemployment trade-off, but the terms of that trade-off have improved in recent years.
C. there is no inflation-unemployment trade-off.
D. attempts to "fine-tune" the economy cause the rate of unemployment to accelerate.
C. there is no inflation-unemployment trade-off.
-
Inflation accompanied by falling real output and employment is known as:
A. Laffer's law.
B. Okun's law.
C. stagflation.
D. the Phillips Curve.
C. stagflation.
-
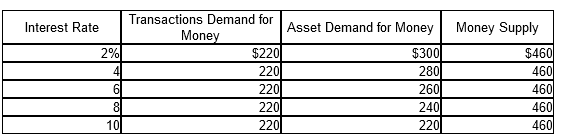
Based on the given table, an increase in the money supply of $20 billion will cause the equilibrium interest rate to
A. rise by 4 percentage points.
B. fall by 2 percentage points.
C. rise by 2 percentage points.
D. fall by 4 percentage points.
B. fall by 2 percentage points.
-
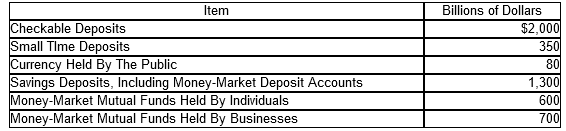
The accompanying table contains hypothetical data for an economy. The size of the M2 money supply is
A. $3,980.
B. $4,330.
C. $4,470.
D. $3,730.
B. $4,330.
-
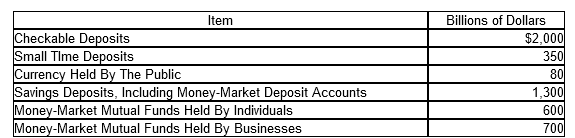
The accompanying table contains hypothetical data for an economy. The size of the M1 money supply is
A. $2,730.
B. $2,220.
C. $1,940.
D. $2,080.
D. $2,080.
-
Money functions as:
A. a unit of account.
B. a store of value.
C. a store of value, a unit of account, and a medium of exchange.
D. a medium of exchange.
C. a store of value, a unit of account, and a medium of exchange.
-
Open-market operations refer to:
A. purchases of stocks in the New York Stock Exchange.
B. the purchase or sale of government securities, as well as collateralized money loans, by the Fed.
C. central bank lending to commercial banks.
D. the specifying of loan maximums on stock purchases.
B. the purchase or sale of government securities, as well as collateralized money loans, by the Fed.
-
Paper money (currency) in the United States is issued by the:
A. national banks.
B. U.S. Mint.
C. Federal Reserve Banks.
D. U.S. Treasury.
C. Federal Reserve Banks.
-
Purchasing groceries using a debit card best exemplifies money serving as a:
A. index of satisfaction.
B. medium of exchange.
C. store of value.
D. unit of account.
B. medium of exchange.
-
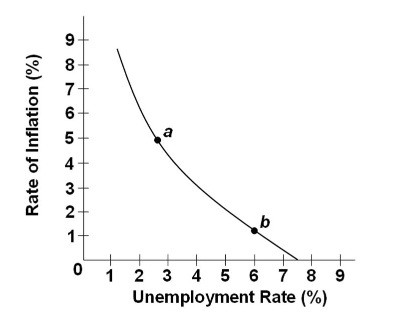
The curve on this graph is known as a:
A. production possibilities curve.
B. Phillips Curve.
C. Laffer Curve.
D. labor demand curve.
B. Phillips Curve.
-
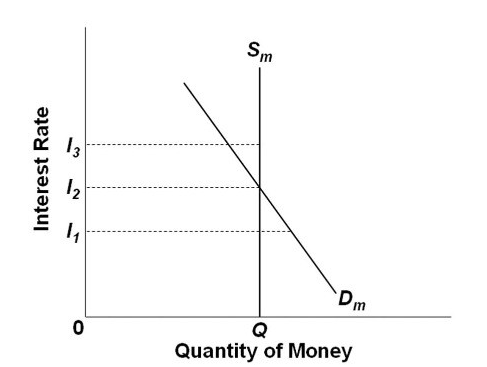
Refer to the diagram of the market for money. The downward slope of the money demand curve Dm is best explained in terms of the:
A. wealth or real-balances effect.
B. transactions demand for money.
C. direct or positive relationship between bond prices and interest rates.
D. asset demand for money.
D. asset demand for money.
-
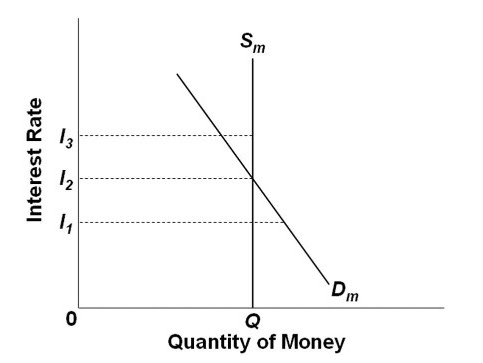
Refer to the diagram of the market for money. The equilibrium interest rate is:
A. I1.
B. I2.
C. I3.
D. not determinable without additional information.
B. I2.
-
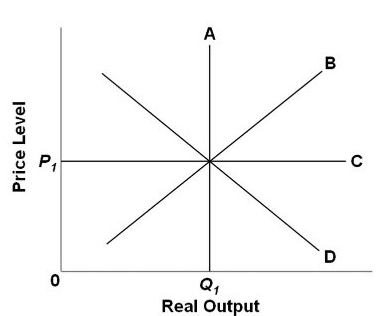
Refer to the diagram relating to short-run and long-run aggregate supply. The:
A. long-run aggregate supply curve is B.
B. short-run aggregate supply curve is A.
C. short-run aggregate supply curve is B.
D. long-run aggregate supply curve is D.
C. short-run aggregate supply curve is B.
-
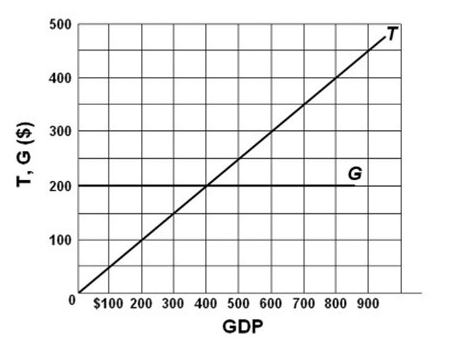
Refer to the diagram, in which T is tax revenues and G is government expenditures. All figures are in billions. In this economy,
A. tax revenues vary directly with GDP, but government spending is independent of GDP.
B. tax revenues and government spending both vary directly with GDP.
C. government spending varies directly with GDP, but tax revenues are independent of GDP.
D. tax revenues and government spending both vary inversely with GDP.
A. tax revenues vary directly with GDP, but government spending is independent of GDP.
-
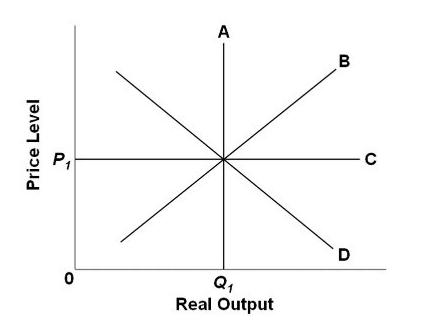
Refer to the diagram. The long-run aggregate supply curve is:
A. A.
B. B.
C. C.
D. D.
A. A.
-
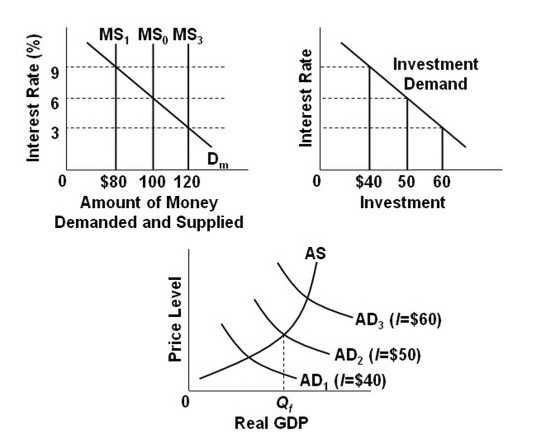
Refer to the diagrams. The numbers in parentheses after the AD1, AD2, and AD3 labels indicate the levels of investment spending associated with each curve. All figures are in billions. If aggregate demand is AD3 and the monetary authorities desire to reduce it to AD2, they should:
A. decrease the interest rate from 3 percent to 9 percent.
B. increase the money supply from $100 to $120.
C. increase the interest rate from 3 percent to 9 percent.
D. decrease the money supply from $120 to $100.
D. decrease the money supply from $120 to $100.
-
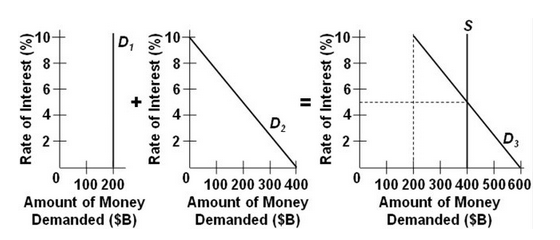
Refer to the given market-for-money diagrams. The total demand for money is shown by:
A. D1.
B. D2.
C. D3.
D. S.
C. D3.
-
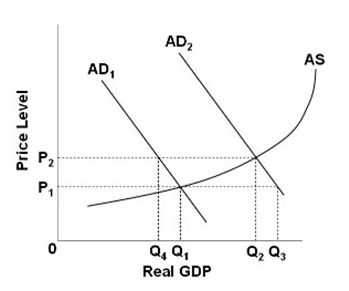
Refer to the graph. Assume that the economy is in a recession with a price level of P1 and output level Q1. The government then adopts an appropriate discretionary fiscal policy. What will be the most likely new equilibrium price level and output?
A. P2 and Q2
B. P1 and Q1
C. P2 and Q4
D. P1 and Q3
A. P2 and Q2
-
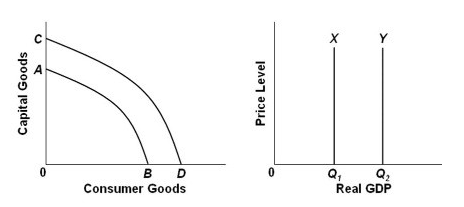
Refer to the graphs. Growth of production capacity is shown by:
A. both the shift from AB to CD and the shift from Y to X.
B. both the shift from AB to CD and the shift from X to Y.
C. the shift from X to Y only.
D. the shift from AB to CD only.
B. both the shift from AB to CD and the shift from X to Y.
-
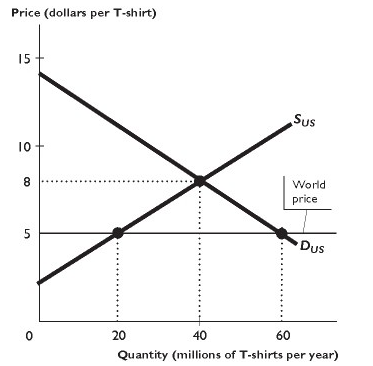
Suppose the world price of widgets is $5 each. If a widget-importing country imposed a $2 per widget tariff, what price would that country's consumers pay for widgets?
A. $7
B. $3
C. $10
D. $5
E. A price that is greater than $5 and less than $7
A. $7
-
The M1 money supply is composed of:
A. all coins and paper money held by the general public and the banks.
B. checkable deposits and currency in circulation.
C. bank deposits of households and business firms.
D. bank deposits and mutual funds.
B. checkable deposits and currency in circulation.
-
The amount by which government expenditures exceed revenues during a particular year is the:
A. budget deficit.
B. public debt.
C. GDP gap.
D. full employment.
A. budget deficit.
-
The asset demand for money:
A. is unrelated to both the interest rate and the level of GDP.
B. varies inversely with the level of real GDP.
C. varies directly with the level of nominal GDP.
D. varies inversely with the rate of interest.
D. varies inversely with the rate of interest.
-
The asset demand for money is most closely related to money functioning as a:
A. unit of account.
B. medium of exchange.
C. store of value.
D. measure of value.
C. store of value.
-
The crowding-out effect of expansionary fiscal policy suggests that:
A. increases in government spending financed through borrowing will increase the interest rate and thereby reduce investment.
B. it is very difficult to have excessive aggregate spending in the U.S. economy.
C. consumer and investment spending always vary inversely.
D. tax increases are paid primarily out of saving and therefore are not an effective fiscal device.
A. increases in government spending financed through borrowing will increase the interest rate and thereby reduce investment.
-
The currency, or money, of the United States, like those of other countries, is:
A. intrinsic money.
B. token money.
C. commodity money.
D. deposit money.
B. token money.
-
The cyclically adjusted budget refers to:
A. the number of workers who are underemployed when the level of unemployment is 4 to 5 percent.
B. the inflationary impact that the automatic stabilizers have in a full-employment economy.
C. the size of the federal government's budgetary surplus or deficit when the economy is operating at full employment.
D. that portion of a full-employment GDP that is not consumed in the year it is produced.
C. the size of the federal government's budgetary surplus or deficit when the economy is operating at full employment.
-
The discount rate is the rate of interest at which:
A. savings and loan associations lend to some builders.
B. Federal Reserve Banks lend to large corporations.
C. commercial banks lend to large corporations.
D. Federal Reserve Banks lend to commercial banks.
D. Federal Reserve Banks lend to commercial banks.
-
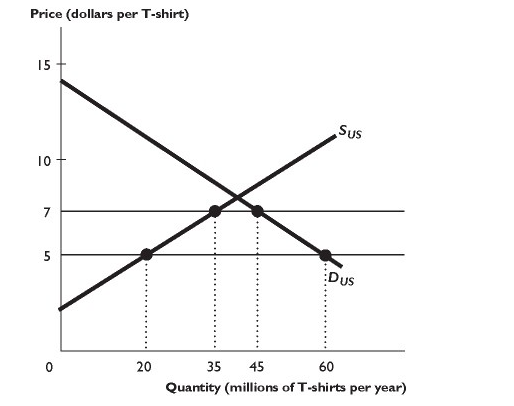
The figure above shows the U.S. market for T-shirts, where SUS is the domestic supply curve and DUS is the domestic demand curve. The world price of a T-shirt is $5. The U.S. government imposes a $2 per unit tariff on imported T-shirts.The figure above shows that the government revenue from the tariff is
A. $20 million per year.
B. $15 million per year.
C. zero.
D. $55 million per year.
E. $30 million per year.
A. $20 million per year.
-
The figure above shows the U.S. market for T-shirts, where SUS is the domestic supply curve and DUS is the domestic demand curve. The world price of a T-shirt is $5. The U.S. government imposes a $2 per unit tariff on imported T-shirts.The figure above shows that as a result of the tariff, the quantity of T-shirts produced in the United States ________, and the quantity of T-shirts imported ________.A. decreases by 30 million per year; increases by 30 million per year
B. increases by 15 million per year; increases by 15 million per year
C. decreases by 15 million per year; decreases by 30 million per year
D. does not change; decreases by 15 million per year
E. increases by 15 million per year; decreases by 30 million per year
E. increases by 15 million per year; decreases by 30 million per year
-
The figure above shows the U.S. market for T-shirts, where SUS is the domestic supply curve and DUS is the domestic demand curve. The world price of a T-shirt is $5. The U.S. government imposes a $2 per unit tariff on imported T-shirts.The figure above shows that as a result of the tariff, the price of a T-shirt in the United States ________, and the quantity of T-shirts bought ________.
A. rises by $2; decreases by 15 million per year
B. does not change; does not change
C. rises by $2; increases by 15 million per year
D. falls by $2; increases by 5 million per year
E. does not change; decreases by 5 million per year
A. rises by $2; decreases by 15 million per year
-
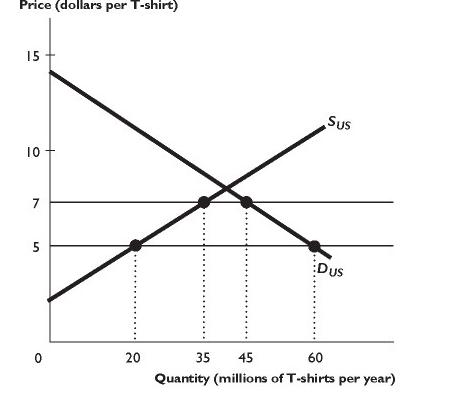
The figure above shows the U.S. market for T-shirts, where SUS is the domestic supply curve and DUS is the domestic demand curve. The United States trades freely with the rest of the world. The world price of a T-shirt is $5. In the figure above, with international trade the United States ________ million T-shirts per year.
A. imports 20
B. exports 20
C. imports 40
D. exports 40
E. imports 60
C. imports 40
-
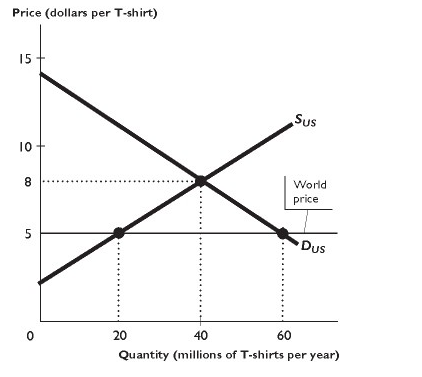
The figure above shows the U.S. market for T-shirts, where SUS is the domestic supply curve and DUS is the domestic demand curve. The United States trades freely with the rest of the world. The world price of a T-shirt is $5. Based on the figure above, as a result of international trade, U.S. domestic production ________ million T-shirts per year.
A. decreases by 10
B. increases by 20
C. increases by 40
D. decreases by 20
E. increases by 10
D. decreases by 20 million T-shirts per year.
-
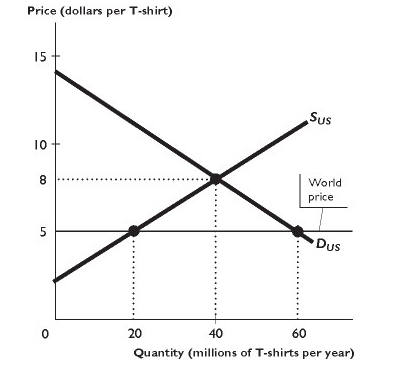
The figure above shows the U.S. market for T-shirts, where SUS is the domestic supply curve and DUS is the domestic demand curve. The United States trades freely with the rest of the world. The world price of a T-shirt is $5. In the figure above, with international trade U.S. consumers buy ________ million T-shirts per year at ________ per T-shirt.
A.40; $5
B.20; $5
C.40; $8
D.60; $11
E.60; $5
E.60; $5
-
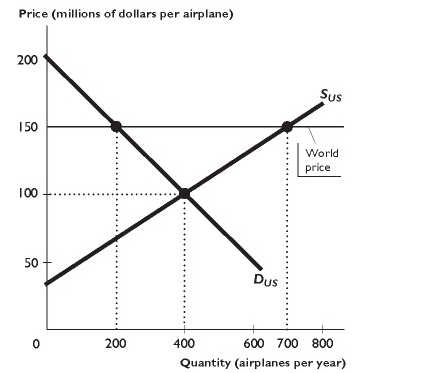
The figure above shows the U.S. market for airplanes, where SUS is the domestic supply curve and DUS is the domestic demand curve. The United States trades freely with the rest of the world. The world price of an airplane is $150 million. In the figure above, the United States ________ airplanes per year.
A. imports 400
B. exports 200
C. exports 400
D. imports 500
E. exports 500
E. exports 500
-
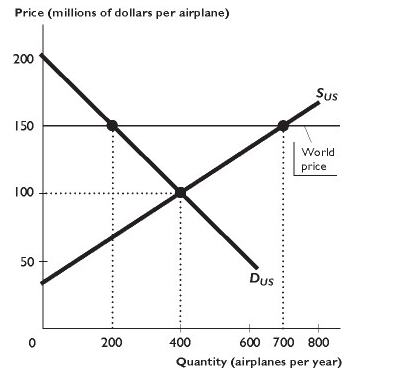
The figure above shows the U.S. market for airplanes, where SUS is the domestic supply curve and DUS is the domestic demand curve. The United States trades freely with the rest of the world. The world price of an airplane is $150 million. In the figure above, U.S. consumers buy ________ airplanes per year at ________ million per airplane.
A. 200; $150
B. 400; $100
C. 200; $100
D. 400; $150
E. 700; $150
A. 200; $150
-
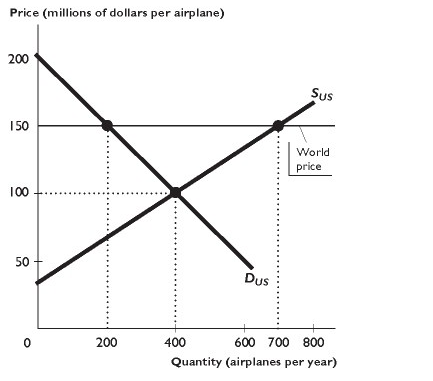
The figure above shows the U.S. market for airplanes, where SUS is the domestic supply curve and DUS is the domestic demand curve. The United States trades freely with the rest of the world. The world price of an airplane is $150 million. Based on the figure above, as a result of international trade, U.S. domestic production ________ airplanes per year.
A. decreases by 100
B. increases by 200
C. increases by 500
D. decreases by 200
E. increases by 300
E. increases by 300
-
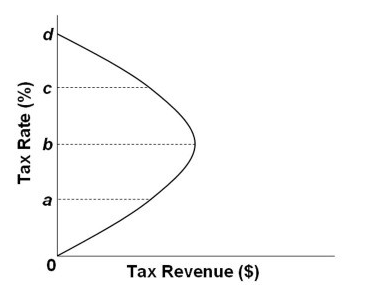
The given curve is known as the:
A. Taylor rule.
B. Phillips Curve.
C. Laffer Curve.
D. Okun Curve.
C. Laffer Curve.
-
The interest rate that banks charge one another on overnight loans is called the:
A. overnight lending rate.
B. prime lending rate.
C. discount rate.
D. federal funds rate.
D. federal funds rate.
-
The paper money used in the United States is:
A. United States notes.
B. Federal Reserve notes.
C. Treasury notes.
D. National Bank notes.
B. Federal Reserve notes.
-
The purchasing power of money and the price level vary:
A. inversely.
B. directly and proportionately.
C. directly but not proportionately.
D. directly during recessions but inversely during inflations.
A. inversely.
-
The transactions demand for money is most closely related to money functioning as a:
A. store of value.
B. unit of account.
C. measure of value.
D. medium of exchange.
D. medium of exchange.
-
When governments specify the maximum amount of a good that may be imported in a given period of time, they are establishing a:
A. dynamic tariff.
B. dumping limit.
C. quota.
D. tax.
E. tariff.
C. quota.
-
When protection is encouraged to protect a growing domestic industry, the following is being used:
A. diversity and stability argument
B. save domestic jobs argument
C. anti-dumping argument
D. infant-industry argument
E. national security argument
D. infant-industry argument
-
When the Fed acts as a "lender of last resort," as it did in the financial crisis of 2007-2008, it is performing its role of:
A. being the bankers' bank.
B. controlling the money supply.
C. providing for check clearing and collection.
D. setting the reserve requirements.
A. being the bankers' bank.
-
Which group is responsible for the policy decision of changing the money supply?
A. Thrift Advisory Council
B. Federal Advisory Council
C. Federal Open Market Committee
D. Office of Management and Budget
C. Federal Open Market Committee
-
Which of the following allegedly contributed to the stagflation in the mid-1970s?
A. a sharp drop in the prices of farm products
B. rising productivity in manufacturing
C. a dramatic increase in oil prices
D. appreciation of the dollar
C. a dramatic increase in oil prices
-
Which of the following will happen when the Federal Reserve buys bonds from the public in the open market and the amount of cash held by the public does not change?
A. Commercial bank reserves will increase.
B. The money supply will decrease.
C. The deposits of commercial banks will decline.
D. The required reserve ratio will increase.
A. Commercial bank reserves will increase.
-
______ occurs when a foreign firm sells its exports at a lower price than its cost of production.
A. The trickle-down effect
B. Tariff avoidance
C. Rent seeking
D. Dumping
E. Nontariff barrier protection
D. Dumping

