 Bailey N
Central tendency and Variability Exercises
Finding measures of central tendency What measures of central tendency should be used with what type of data Finding the IQR Finding the variance Finding the standard deviation
-
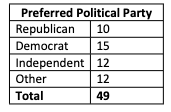
Using the following data, determine what L.o.M this variable is and calculate all appropriate measures of central tendency
L.o.M = Nominal (can't be ranked)
Only mode is appropriate
Mode = Democrat (the most common category, not the frequency of it)
-
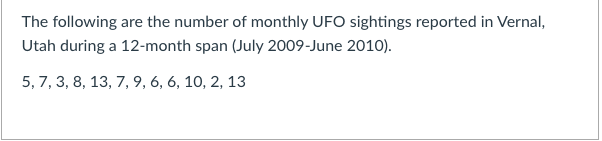
Using the following data, determine what L.o.M this variable is and calculate all appropriate measures of central tendency
L.o.M = Interval/ratio
Mode, median, and mean can be used
Mode = Trimodal; 6, 7, 13
Median = 7
Mean = 7.4
-
What would be the most appropriate measure of central tendency for a variable representing the typical age of persons killed by drunk drivers?
The mean if symmetrical
The median if the data is skewed
-
What would be the most appropriate measure of central tendency for a variable representing the typical economic class of those in prison?
The median because this is ordinal data and the mean can ONLY be used on interval/ratio variables
-
What would be the most appropriate measure of central tendency for a variable representing the typical height of NBA players?
The mean because it's interval/ratio
-
What would be the most appropriate measure of central tendency for a variable representing the typical race of those in the NASA space program?
The mode is the only M.C.T we can use on nominal variables like this one
-

Use the following data to calculate the range, variability, and standard deviation of Tom's data
Range = 10
Variance = 14.5
Standard deviation = 3.8
-

Use the following data to calculate the range, variability, and standard deviation of Jenni's data
Range = 2
Variance = 0.5
Standard deviation = 0.7
-
Using the final exam scores of a particular class [90, 85, 70, 95, 100, 100, 80, 83] Determine the range, IQR, variance, and standard deviation
Range = 30
IQR = 16
Variance = 108.98
Standard deviation = 10.44
-
Using the final exam scores of a particular class [100, 40, 85, 60, 75, 90, 85, 50] Determine the range, IQR, variance, and standard deviation
Range = 60
IQR = 32.5
Variance = 442.41
Standard deviation = 21.03
-
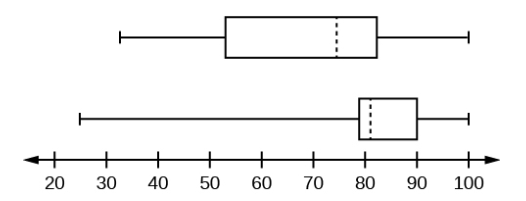
These box plots represent the exam scores of two classes. Determine their medians, ranges, IQRs, and if they're skewed
Box plot #1 Median = 75 Range = 68 IQR = 28 Skew = negative (tail points to the left)
Box plot #2 Median = 81 Range = 75 IQR = 11 Skew = negative (tail points to the left)
The exact points are hard to determine, so answers within 3 numbers of these are acceptable

