 Fatima Adam

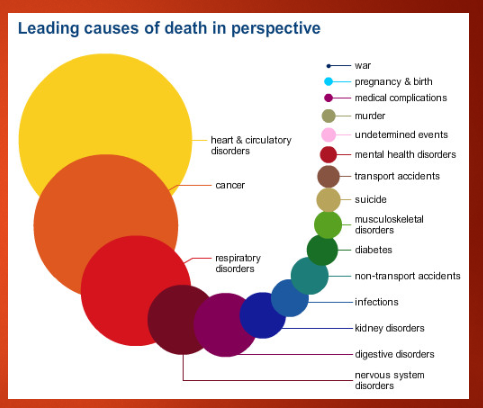
Association Analysis (Genomics)
Association Analysis This session is aimed at teaching the underlying principles of how associations between variants in DNA and traits, or diseases, are identified. It will explain the genetic term "association" and how this has been expanded into the genome-wide association study (GWAS) that has resulted in the identification of many gene variants associated with common disease. Learning Outcomes On successful completion of the lecture, students should be able to: Define the term “Genetic Association” Describe how a genetic association study is conducted Describe an ideal genetic marker and how SNPs fit this description Describe the principles of a genome-wide association study (GWAS) Describe and interpret a Manhattan plot Describe and interpret a regional association plot Describe meta-analysis and how it is used in genetic studies Describe the known problems with GWAS Give an example of how GWAS has identified susceptibility variants in genes in a common disease Describe the relationship between genetic association and linkage disequilibrium
-
What is “Genetic Association”? (2)
Genetic association refers to the relationship between a genetic variation (such as a SNP) and a particular trait or disease in a population.
A genetic association study seeks to identify whether specific genetic variants are statistically linked to a particular phenotype (disease or trait).
-
How is a genetic association study conducted? (4)
Select a population: Individuals are grouped based on the presence or absence of the phenotype or disease.
Collect genetic data: DNA samples are collected from individuals, and genetic variants (e.g., SNPs) are genotyped.
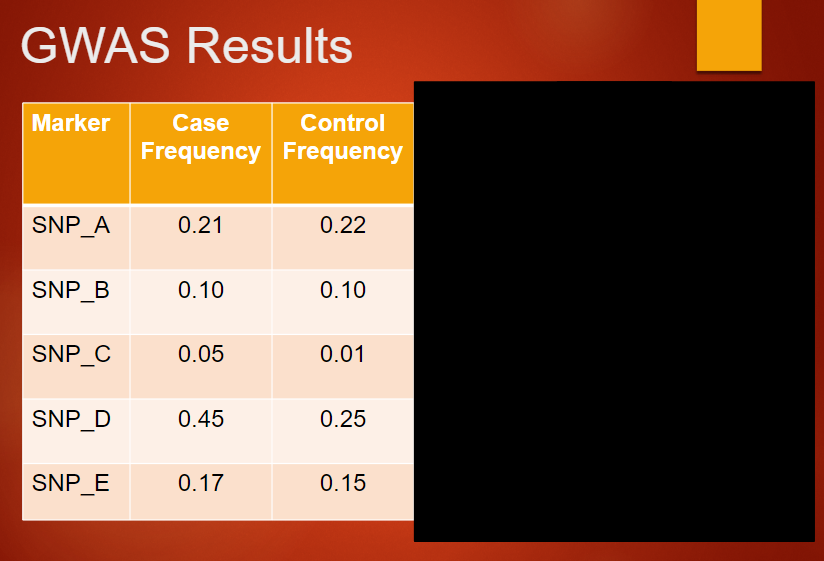
Statistical analysis: The frequency of genetic variants is compared between individuals with and without the trait to identify associations.
Interpretation: Identify variants that are significantly associated with the disease or phenotype.
-
What makes an ideal genetic marker, and how do SNPs fit this description? (4)
Common variants: The marker should be common in the population to have enough statistical power.
Biallelic: The marker should have two alleles to simplify analysis.
Located in or near a gene: To help correlate the variant with traits or diseases.
SNPs: SNPs (single nucleotide polymorphisms) fit these criteria, being common, biallelic, and located throughout the genome, making them useful in genetic studies.
-
What are the principles of a Genome-Wide Association Study (GWAS)? (5)
GWAS aims to identify common genetic variants associated with diseases or traits.
Large sample sizes: Involves comparing the genomes of thousands of individuals with and without the condition.
Markers analyzed: SNPs are typically used as genetic markers for detecting associations.
Statistical significance: Associations are determined through statistical analysis, identifying variants significantly linked to the phenotype.
No predefined hypothesis: GWAS scans the whole genome without prior assumptions about which genes might be involved.
-
What is a Manhattan plot, and how do you interpret it? (3)
A Manhattan plot is a graphical representation of GWAS results, showing the association between SNPs and a phenotype.
X-axis: Chromosomal positions of the SNPs.
Y-axis: Statistical significance of the associations (often in -log10 scale). A peak indicates a significant association with a trait.
-
What is a regional association plot, and how do you interpret it? (3)
A regional association plot shows the association between genetic variants in a specific genomic region.
X-axis: Genomic position within the region of interest.
Y-axis: Statistical significance of the associations.
Interpretation: A large peak suggests that a genetic variant in this region is strongly associated with the trait or disease.
-
What is meta-analysis, and how is it used in genetic studies? (3)
Meta-analysis is the statistical technique of combining results from multiple studies to increase the overall sample size and statistical power.
In genetic studies, meta-analysis is used to combine GWAS results from different populations or cohorts.
It improves the reliability of findings and helps identify consistent genetic associations across different studies.
-
What are the known problems with GWAS? (4)
Confounding factors: Environmental and lifestyle factors can obscure genetic findings.
Population stratification: Differences in ancestry between populations can lead to false associations.
Rare variants: GWAS may not effectively detect rare variants with large effects.
Missing heritability: GWAS may fail to explain the full genetic contribution to complex traits
-
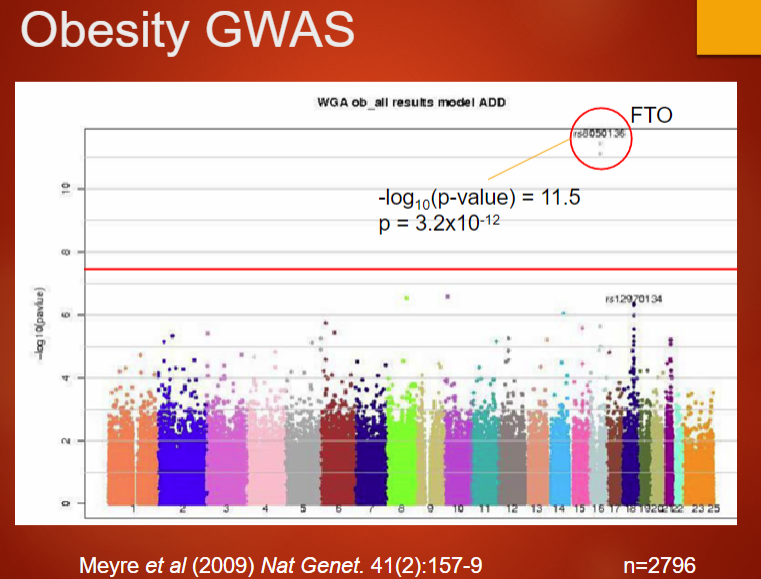
Give an example of how GWAS has identified susceptibility variants in genes for common diseases. (2)
Example: GWAS has identified FTO gene variants associated with obesity. These variants influence body mass index (BMI) and obesity susceptibility.
GWAS has also identified variants in the APOE gene associated with Alzheimer’s disease susceptibility.
-
What is the relationship between genetic association and linkage disequilibrium? (3)
Linkage disequilibrium (LD) is the non-random association of alleles at different loci.
In genetic association studies, LD can influence the identification of disease-related variants, as alleles at loci in high LD may co-occur.
A genetic association can occur due to LD between the SNP and the true causal variant, even if the SNP itself is not the causative variant.
-
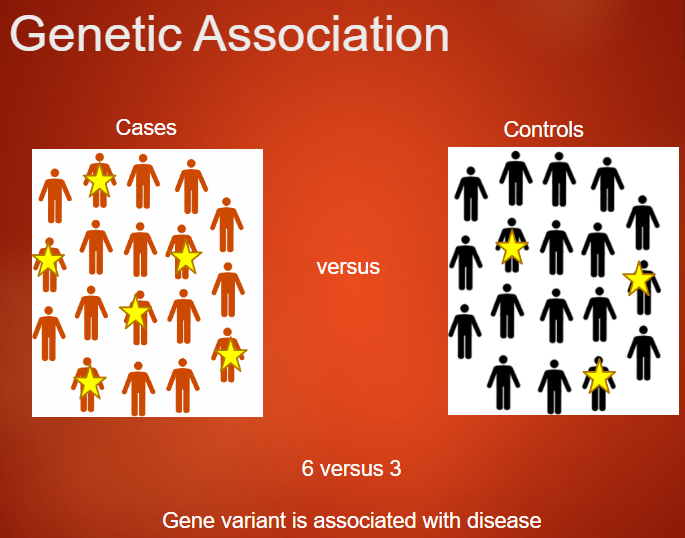
What is Genetic Association? (3)
Genetic association refers to the presence of an allele at a higher frequency in individuals with a specific trait compared to those without the trait.
This concept is used to investigate whether variants in the genome are related to a disease or trait.
In genetic studies, case-control studies are conducted to test for genetic associations by comparing cases (disease present) with controls (disease absent).
-
What is a Case-Control Study? (5)
A case-control study compares individuals with a specific disease (cases) to individuals without the disease (controls).
Cases: Individuals who have the disease or condition of interest (e.g., obesity, schizophrenia, hypertension).
Disease Definition: The disease must be defined rigorously and consistently across all cases.
Controls: Individuals without the disease, carefully matched for factors like age, sex, ancestry, and other non-disease traits.
Platform for data generation: Data from both cases and controls should be collected using the same methodology to reduce bias.
-
Picture demonstrating genetic association:
-
How is a Case-Control Genetic Study Conducted? (5)
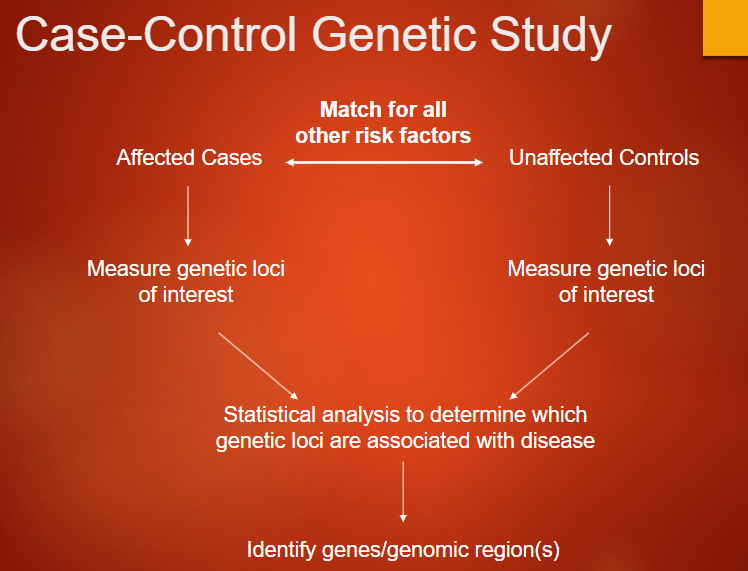
Affected Cases: Individuals who have the disease or condition of interest.
Unaffected Controls: Individuals who do not have the disease, matched for other risk factors such as age, sex, and ancestry.
Measure Genetic Loci: Both groups (cases and controls) have their genetic loci of interest measured.
Statistical Analysis: Statistical methods are used to compare the genetic data of cases and controls, identifying which genetic loci are associated with the disease.
Identify Genes/Genomic Regions: The analysis helps pinpoint specific genes or genomic regions that may be linked to the disease.
-
What is Needed for a Case-Control Genetic Study? (5)
Large Numbers of Well-Defined Cases: A large sample size of cases, typically in the tens of thousands, to ensure statistical power.
Matched Controls: An equal or greater number of unrelated controls matched for factors like age, sex, and ethnicity.
Reliable Genotyping Technology: Technology such as SNP microarrays to accurately measure genetic variations.
Standard Statistical Analysis: Tools like PLINK for analyzing genetic data and identifying associations.
Replication of Positive Associations: To confirm the validity of results, any positive associations should be replicated in independent studies.
-
Describe the ideal genetic marker (7)
Polymorphic
Randomly distributed across the genome
Fixed location in the genome
Frequent in the genome
Frequent in the population
Stable with time
Easy to assay (genotype)
-
Describe a Single Nucleotide Polymorphism (SNP) (3)
Common in the genome (~1/300 nucleotides)
~12 million common SNPs identified in the human genome
Generated by mismatch repair
-
Where can SNPs occur in the genome? (7)
Gene - coding region (1% of genome)
No amino acid change (synonymous)
Amino acid change (non-synonymous)
New stop codon (nonsense)
Gene - non-coding region
Promoter – mRNA and protein level changed
Enhancer – mRNA and protein level changed
Splice site – altered mRNA, altered protein
Intergenic region (50% of genome)
-
Describe the dbSNP online database at NCBI (4)
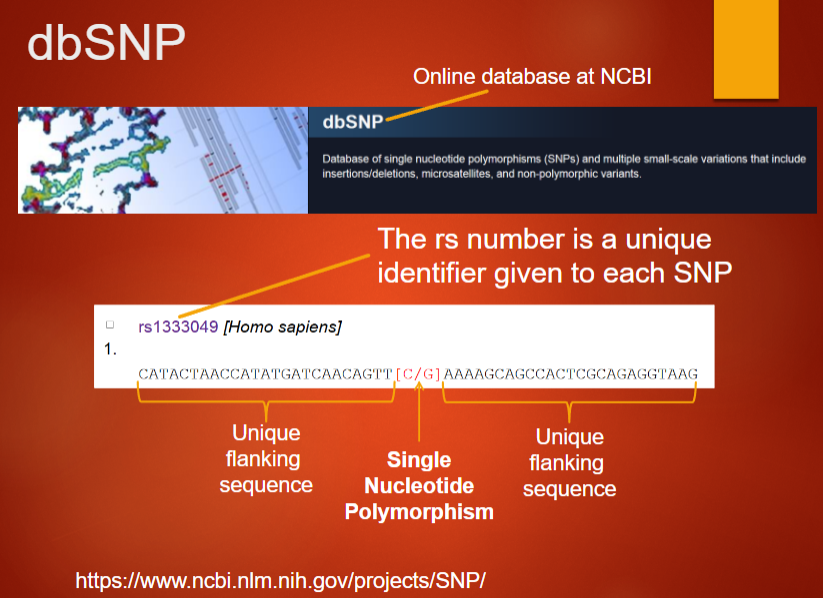
Provides a unique identifier (rs number) for each SNP
Stores information about SNPs and their associated variations
Includes flanking sequence data for each SNP
Maintained by NCBI (National Center for Biotechnology Information)
-
Describe Minor Allele Frequency (MAF) (4)
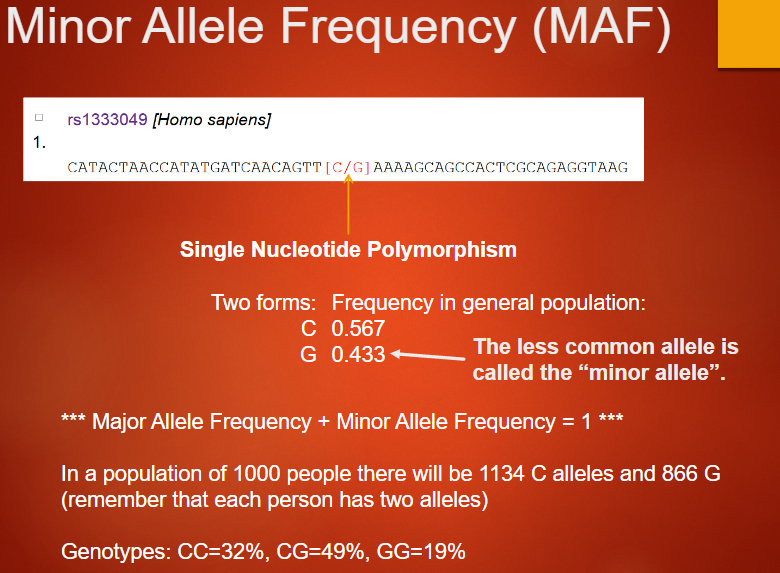
Refers to the frequency of the less common allele in a population
The minor allele's frequency is less than 0.5, while the major allele is more common
In the example, C has a frequency of 0.567, and G has 0.433
The sum of major and minor allele frequencies equals 1 (Major Allele Frequency + Minor Allele Frequency = 1)
-
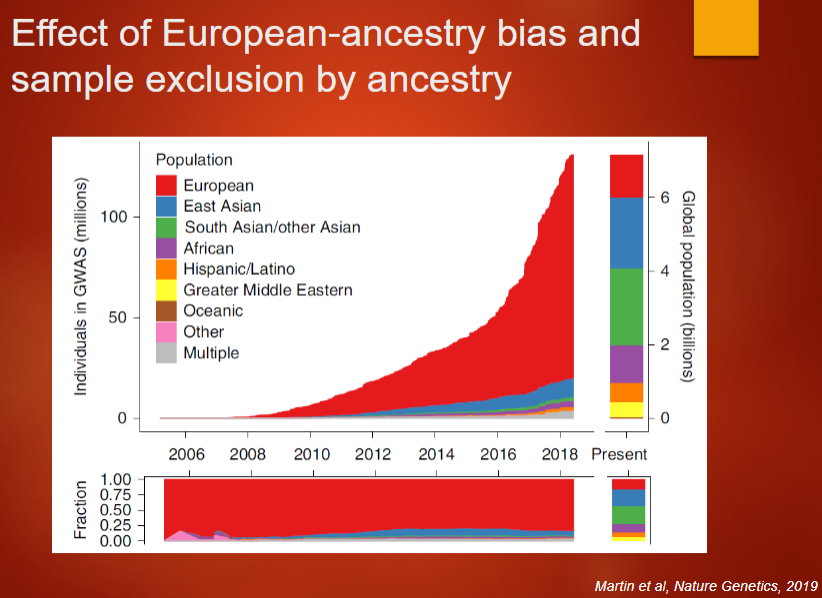
Describe how Minor Allele Frequencies (MAFs) can vary by ancestry or population group (4)
MAFs can differ significantly across different populations or ancestry groups
The allele frequency for a particular SNP, such as rs6801957, can vary in populations with different genetic backgrounds
This variation can impact the association of certain genetic traits or diseases, such as Brugada syndrome, which is linked to arrhythmia
Understanding MAFs across diverse populations is important for accurate disease association studies
-
Describe the importance of matching cases and controls by ancestry in genetic studies (4)
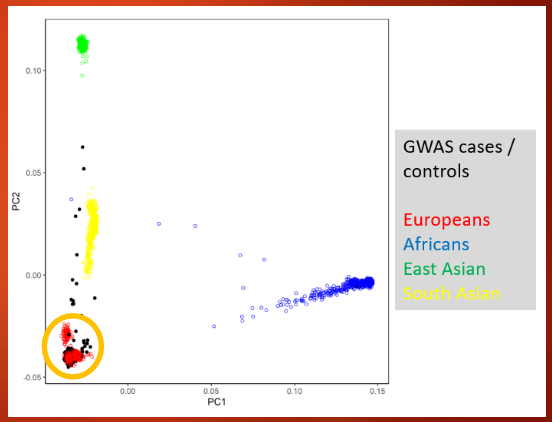
MAFs can differ across different populations, which makes matching cases and controls by ancestry essential
Failure to match by ancestry can lead to spurious signals, causing false associations
In practice, studies often focus on populations of European ancestry in regions like Europe and the US
Excluding individuals of other ancestries can prevent confounding factors and improve the accuracy of genetic association results
-
Picture demonstrating Effect of European-ancestry bias andsample exclusion by ancestry:
-
Describe the role of Minor Allele Frequency (MAF) in genetic association studies (5)
SNPs are selected for genetic studies based on their MAF, with common diseases often linked to common variants
The rarer the variant, the more samples are needed to detect significant associations
SNPs with MAF > 0.05 (5%) are typically used in studies, although this is now reducing to > 0.01 (1%) with larger sample sizes like in the UK Biobank
The power of the study increases as the frequency of the variant becomes more common
Studies are trending toward examining rare variants as large-scale studies continue to expand
-
Describe linkage disequilibrium (LD) and its role in GWAS (5)
SNPs in close proximity on a chromosome tend to be inherited together, a phenomenon known as linkage disequilibrium (LD)
LD leads to SNPs being associated with each other more often than would be expected by chance
In GWAS, multiple SNPs in LD at the same locus might show an association, but it is often unclear which SNP is causal
LD is crucial for identifying genomic regions associated with diseases, as many SNPs just "tag" the causal variant
LD complicates pinpointing the exact causal variant, as it could be one of several in close proximity
-
Define the first step in conducting a Genome-Wide Association Study (GWAS) (3)
Define your samples of interest
Recruit large numbers of cases (affected individuals) and matched controls (unaffected individuals)
Use existing datasets like the UK Biobank to define cases and controls based on clinical and demographic characteristics
-
Define the second step in conducting a Genome-Wide Association Study (GWAS) (3)
2. Generate data and clean/quality control
Use reliable genotyping technology, such as SNP microarrays (e.g., Illumina Global Screening Array) to genotype markers across the whole genome
Conduct data quality control (QC) using standard analysis software (e.g., PLINK) to exclude poor-quality SNPs and samples
-
Define the third step in conducting a Genome-Wide Association Study (GWAS) (3)
3. Statistical analysis to identify associated SNPs
Perform statistical tests, like the chi-squared test or more complex logistic regression, to identify associations between disease and allele variations at each marker
A positive association is typically considered at a p-value < 5x10^-8 after correcting for multiple testing
Findings should be replicated in independent datasets to confirm the robustness of the association
-
Describe a Manhattan plot used to present GWAS results (4)
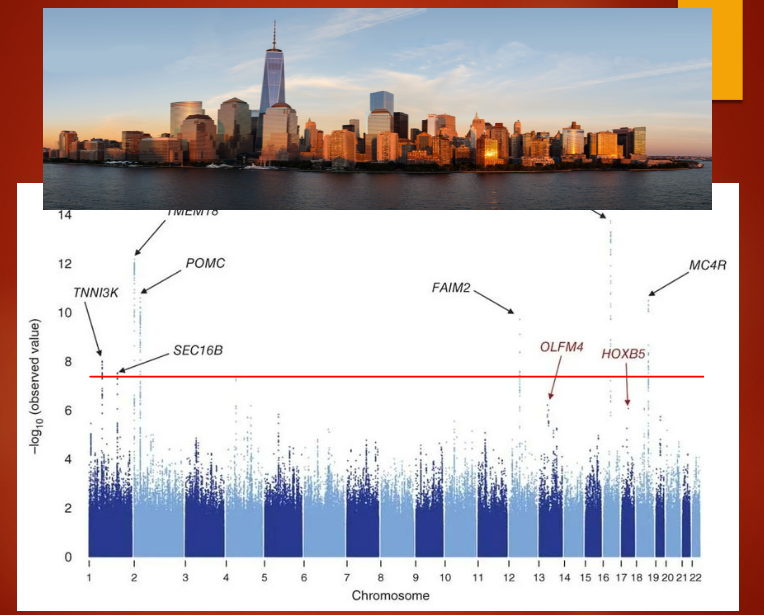
GWAS results are presented as a Manhattan plot.
X-axis represents the position of the SNP on the chromosome.
Y-axis represents the –log10(p-value) of the association between the SNP and the disease.
Typically, more than 1 million SNPs are plotted in the results.
-
Describe the Wellcome Trust Case Control Consortium (WTCCC) (3)
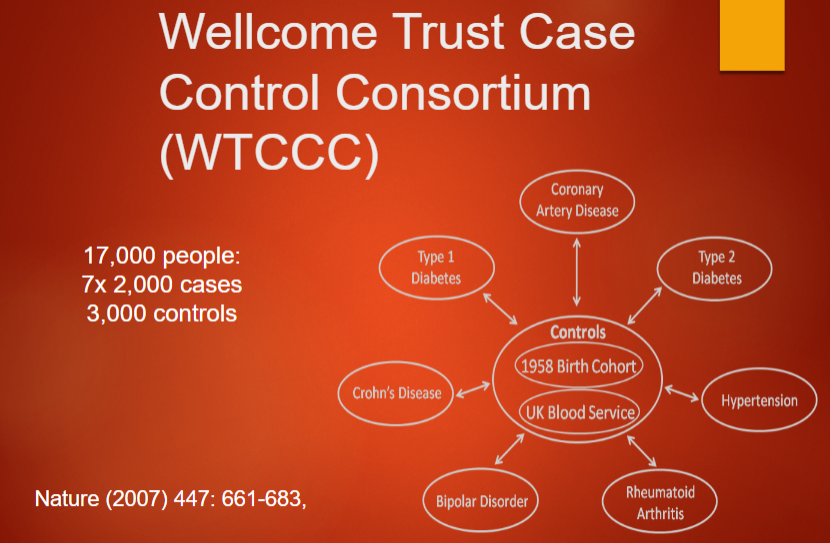
The WTCCC is a major genetic association study involving multiple diseases.
It includes large datasets of cases and controls from different populations.
It was designed to identify genetic variants associated with diseases like diabetes, schizophrenia, and coronary artery disease.
-
Describe the GWAS results from the Wellcome Trust Case Control Consortium (WTCCC) using Manhattan plots (3)
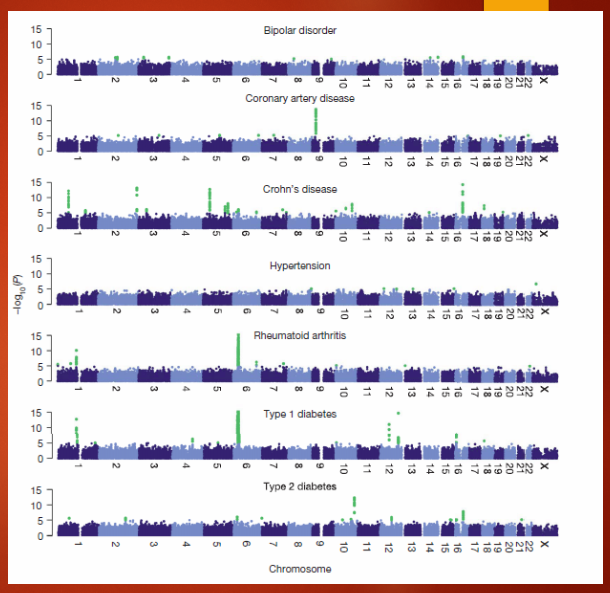
Manhattan plots show the association of SNP markers with seven diseases studied by the WTCCC.
The x-axis represents the position of SNP markers on chromosomes, and the y-axis represents the -log10(p-value).
Green peaks in the plot indicate significant p-values, suggesting strong associations with the diseases.
-
Describe the limitations of GWAS results in identifying the causative gene (3)
The peak of association in GWAS often does not identify the specific gene causing the disease.
The peak indicates the genomic region associated with the disease but does not pinpoint the exact causative variant.
Due to linkage disequilibrium (LD), positive associations can be seen over large regions (>100kbp), making it difficult to identify the exact gene involved.
-
Describe the significance of a QT interval GWAS and its association with heart disease (3)
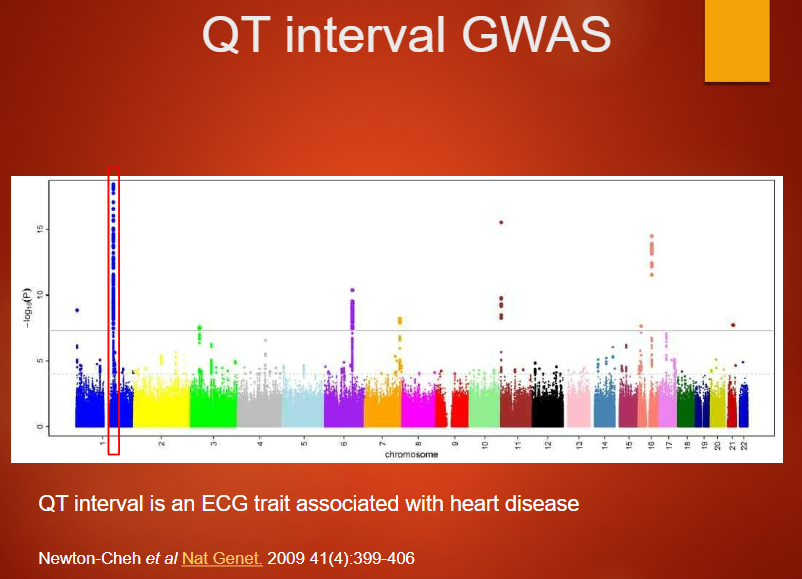
QT interval is an ECG trait that measures the time between the Q and T waves, reflecting ventricular repolarization.
GWAS of the QT interval can identify genetic variants that influence heart rhythm and are associated with heart disease.
Variants identified can help predict risk for conditions like arrhythmias or sudden cardiac death.
-
Describe the regional association plot and its findings related to NOS1AP (3)
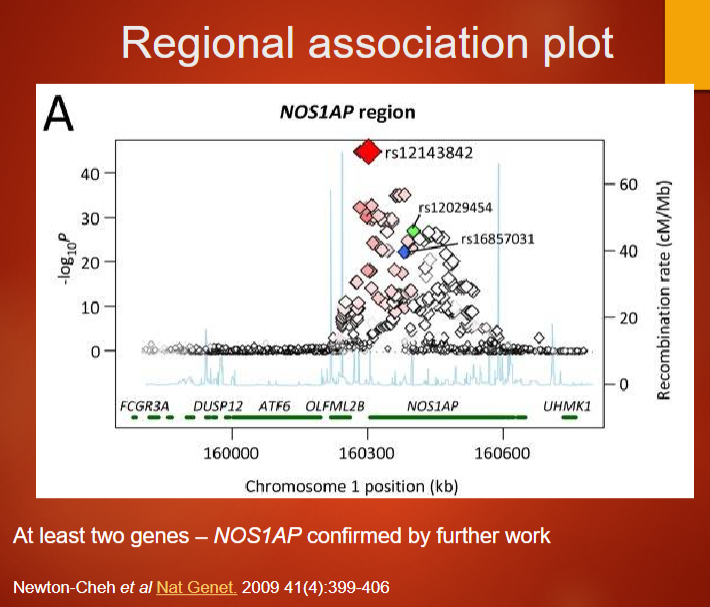
A regional association plot visualizes genetic associations within a specific genomic region, showing SNPs' p-values along the chromosome.
The plot helps identify genes that may be implicated in a trait, such as NOS1AP, which has been linked to cardiac traits like the QT interval.
Further research confirmed NOS1AP's role in regulating QT interval duration, supporting its significance in heart disease.
-
Describe the challenges with GWAS and possible explanations for missing heritability (4)
GWAS has identified numerous statistically significant and reproducible genetic associations, but these do not fully explain the heritability of most diseases.
One challenge is the missed contribution of lower frequency and rare genetic variants, which are often not included in GWAS.
Copy Number Variations (CNVs) may also contribute to disease, but are not always captured in standard GWAS.
Epigenetic variation, such as DNA methylation or histone modification, could play a role in heritability but is not typically covered by GWAS.
-
Describe the challenges with GWAS in identifying causal variants and its clinical implications (4)
Difficulty identifying causal variants: GWAS can find statistical associations, but pinpointing the exact causal variant and understanding the underlying biology is challenging.
European-ancestry bias: Most GWAS are based on populations of European ancestry, limiting our understanding of genetics across diverse populations and creating potential inequities in clinical applications.
Clinical application of disease risk estimates: Using disease risk estimates from GWAS in clinical care remains unclear, and translating findings into practical treatments is challenging.
Inequity in clinical translation: The lack of diverse representation in GWAS can cause skewed results, potentially leading to biased or less effective clinical treatments for non-European populations.
-
Describe meta-analysis and its use in genetic studies (4)
Challenges with large studies: Conducting large studies with over 1,000 cases and controls is difficult.
Combining smaller studies: Meta-analysis combines results from smaller studies to improve statistical power and detect associations.
Pre- and post-experiment meta-analysis: Meta-analysis can be done before experiments (as a consortium) or after experiments to pool results and increase the sample size.
Biobank studies: Large biobank studies, such as the UK Biobank with 500,000 individuals, provide a valuable resource for meta-analysis in genetic research.
-
Describe the genetic influence on obesity and its relation to GWAS (4)
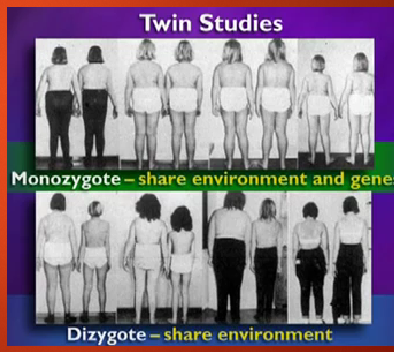
Genetic basis of obesity: Obesity is strongly genetic, with twin studies showing 70-80% of body shape is genetically determined.
Adoption studies: These studies suggest 30-40% of obesity is genetic, showing the importance of genetics over environmental factors.
Family studies: Show a genetic contribution of 40-60% to obesity, supporting the hereditary link.
GWAS for obesity: GWAS can help identify genetic variants associated with obesity by analyzing large populations, providing insights into genetic predisposition.
-
Picture demonstrating obesity GWAS:
-
Describe the large-scale meta-analysis on BMI and its findings (4)
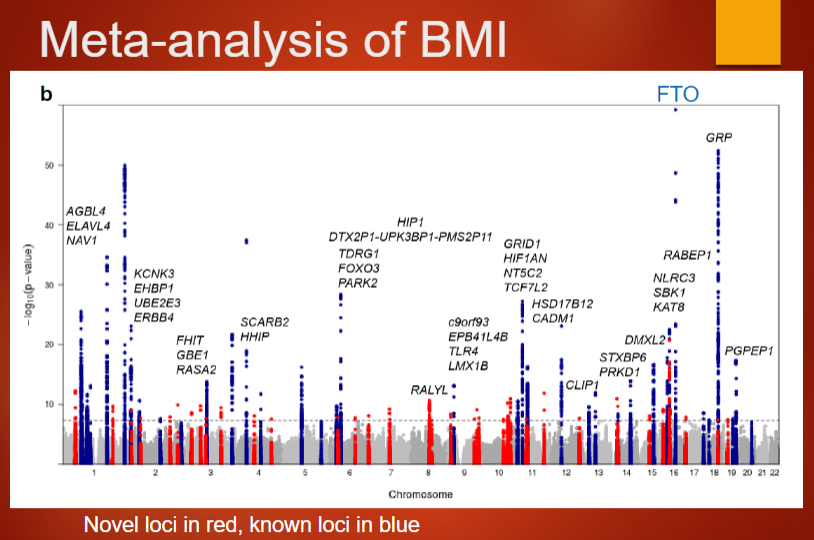
Study details: The meta-analysis involved ~322,000 subjects and was published by Locke et al. in 2015 (Nature 518:197–206).
Number of loci: Identified 97 loci associated with BMI.
Collaborators: Included 125 separate studies with over 600 authors and more than 2000 collaborators.
Study scale: The study demonstrates the power of large-scale collaboration in identifying genetic factors associated with complex traits like BMI.
-
Summarize the findings of GWAS in relation to obesity (3)
Hundreds of loci: GWAS has identified hundreds of loci associated with obesity or BMI-related traits.
Reproducibility: The results are reproducible across different studies.
Understanding remains limited: While many loci are identified, we are still far from fully understanding how all of these genes contribute to obesity.

