stats_4_1_2
advertisement
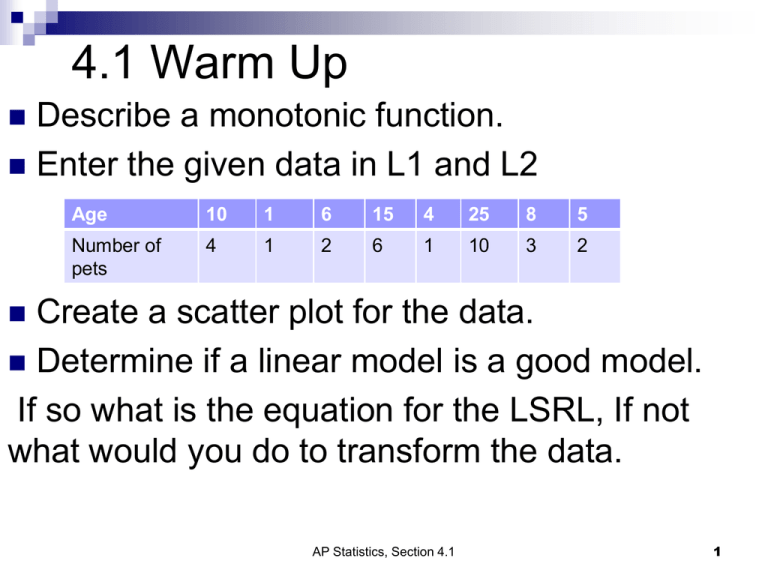
4.1 Warm Up Describe a monotonic function. Enter the given data in L1 and L2 Age 10 1 6 15 4 25 8 5 Number of pets 4 1 2 6 1 10 3 2 Create a scatter plot for the data. Determine if a linear model is a good model. If so what is the equation for the LSRL, If not what would you do to transform the data. AP Statistics, Section 4.1 1 Section 4.1 Exponential Modeling AP Statistics Growth and Decay Linear growth increases by a fixed amount in each equal time period Exponential growth increase by a fixed percentage of the previous total. AP Statistics, Section 4.1 3 Linear Growth X Y Difference 0 5 10-5=5 1 10 15-10=5 2 15 20-15=5 3 20 25-20=5 4 25 30-25=5 5 30 35-30=5 6 35 40-35=5 7 40 AP Statistics, Section 4.1 4 Linear Growth 3 3 3 4 4 4 X Y Difference 0 5 10-5=5 1 10 25-10=15 4 25 40-25=15 7 40 55-40=15 10 55 75-55=20 14 75 95-75=20 18 95 115-95=20 22 115 *Thus the original date is approximately linear. Each chunk has the same difference 5 Exponential Growth is interesting, but what we really want is a linear model AP Statistics, Section 4.1 6 Exponential Growth X Y Difference 0 1 2-1=1 1 2 4-2=2 2 4 8-4=4 3 8 16-8=8 4 16 32-16=16 5 32 64-32=32 6 64 128-64=64 7 128 AP Statistics, Section 4.1 7 Exponential Growth X Y Ratio 0 1 2/1=2 1 2 4/2=2 2 4 8/4=2 3 8 16/8=2 4 16 32/16=2 5 32 64/32=2 6 64 128/64=2 7 128 AP Statistics, Section 4.1 8 Exponential Growth X Y Ratio 0 1 2/1=2 1 2 8/2=4 3 8 32/8=4 5 32 128/32=4 7 128 512/128=4 9 512 4096/512=8 12 4096 32768/4096=8 15 32768 AP Statistics, Section 4.1 Same ratio for x values with the same gap 9 Exponential? To check if a curve is truly exponential you need to look at the ratio between a value and the previous output. Skip non-consecutive values. AP Statistics, Section 4.1 10 Year Subscribers Ratios Log(Sub) 1990 5,283 3.722880611 1993 16,009 4.204364205 1994 24,134 1.507527 4.382629308 1995 33,786 1.399934 4.528736778 1996 44,043 1.303587 4.643876893 1997 55,312 1.255864 4.742819362 1998 69,209 1.251247 4.840162574 1999 86,047 1.243292 4.934735733 AP Statistics, Section 4.1 11 100,000 90,000 80,000 70,000 60,000 50,000 40,000 30,000 20,000 10,000 1988 1990 1992 1994 1996 1998 2000 AP Statistics, Section 4.1 12 Year Subscribers Means 50.7% growth in Ratiossubscribers Log(Sub) that year. Log will undo exponentiation 1990 5,283 3.722880611 1993 16,009 1994 24,134 1.507527 4.382629308 1995 33,786 1.399934 4.528736778 1996 44,043 1.303587 4.643876893 1997 55,312 1.255864 4.742819362 1998 69,209 1.251247 4.840162574 1999 86,047 1.243292 4.934735733 4.204364205 AP Statistics, Section 4.1 13 AP Statistics, Section 4.1 14 6 5 4 3 2 1 0 1988 1990 1992 1994 1996 AP Statistics, Section 4.1 1998 2000 15 Algebraic Properties of Logarithms. 16 AP Statistics, Section 4.1 Example Enter in list 1 0,1,2,3,4,5 Enter in list 2 1,2,4,8,16,32 Enter in list 3 Log(L2) See results Graph Calculate r for L1 and L2 Graph L1 and L2 L1 and L3 Calculate r for L1 and L3 17 Assignment Exercises: 4.6, 4.8, 4.9, 4.11, 4.19, 4.21 AP Statistics, Section 4.1 18

