display
advertisement
COST/WORTH ANALYSIS
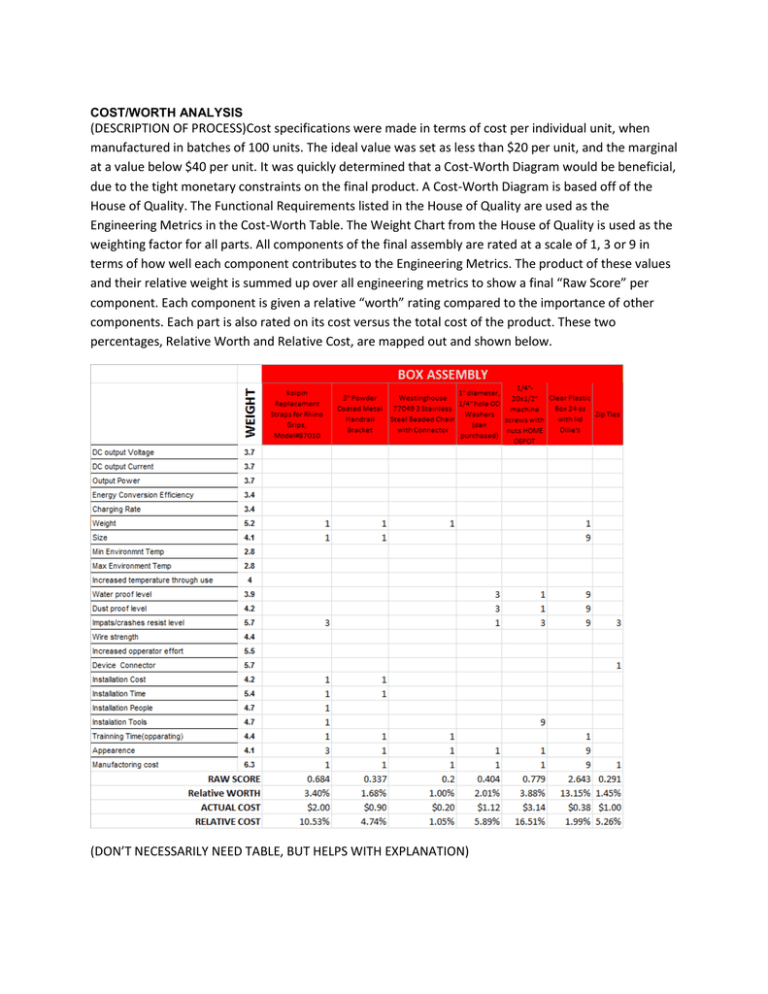
(DESCRIPTION OF PROCESS)Cost specifications were made in terms of cost per individual unit, when
manufactured in batches of 100 units. The ideal value was set as less than $20 per unit, and the marginal
at a value below $40 per unit. It was quickly determined that a Cost-Worth Diagram would be beneficial,
due to the tight monetary constraints on the final product. A Cost-Worth Diagram is based off of the
House of Quality. The Functional Requirements listed in the House of Quality are used as the
Engineering Metrics in the Cost-Worth Table. The Weight Chart from the House of Quality is used as the
weighting factor for all parts. All components of the final assembly are rated at a scale of 1, 3 or 9 in
terms of how well each component contributes to the Engineering Metrics. The product of these values
and their relative weight is summed up over all engineering metrics to show a final “Raw Score” per
component. Each component is given a relative “worth” rating compared to the importance of other
components. Each part is also rated on its cost versus the total cost of the product. These two
percentages, Relative Worth and Relative Cost, are mapped out and shown below.
(DON’T NECESSARILY NEED TABLE, BUT HELPS WITH EXPLANATION)
(RESULTS)As can be seen in Figure X, the ‘ideal’ or ‘fair’ price of each component would lie on the yellow
line, indicating that there is complete balance between how much ‘worth’ that component contributes
to the specifications and how much it costs in terms of overall cost. The red and black curves are 10%
confidence intervals, between which values are still reasonably fairly priced. Any items that fall above
the red 10% curve are too expensive for their relative worth; any items that fall below the black 10% are
extremely cheap for their relative worth. In our case, the Clear Plastic Box and the 2oz Single-Wall White
Jar are very well priced in terms of the value they bring to the project. The ¼”-20x1/2” machine screws
and nuts from Home Depot, however, are a too expensive for their individual contribution to creating a
product that will satisfy specifications. The Kolpin Rubber Replacement Straps are almost too expensive,
but still fall within a reasonable price range. The majority of the components fall on the low end of the
relative worth and relative cost spectrum; this clustering allow for future improvements through the
reduction of the total number of components, there is also potential improvement in finding cheaper
alternatives to the ¼”-20x1/2” screws that are currently in use.
Cost-Worth Diagram
20.00%
(Based on "Total Part Cost" as divisor)
18.00%
1/4"-20x1/2"
machine screws with
nuts HOME DEPOT
16.00%
Relative Cost
14.00%
12.00%
Kolpin Replacement
Straps for Rhino
Grips, Model#87010
10.00%
8.00%
6.00%
4.00%
2 oz Single-Wall
White Jar
2.00%
0.00%
0.00%
2.00%
4.00%
6.00%
8.00%
10.00%
12.00%
Relative Worth
Clear Plastic Box 24 oz
with lid Ollie's
14.00%
16.00%
18.00%
20.00%
AMPL ANALYSIS
(DESCRIPTION OF PROCESS)A linear program aims to optimize a given objective function either through
maximization or minimization. A linear program to determine optimal line balancing was created in
order to prepare for the transition from prototyping to mass manufacturing. The primary assumption is
that the manufacturing site will be working with paced lines, which implies a fixed time frame for each
station regardless of task completion. Additional y, it is assumed that there is an existing demand for our
product, this demand is used to calculate cycle time (our model was run with cycle times of 10 minutes,
30 minutes, and 60 minutes).
The sets within the model are a set of Tasks (T), number of stations (N), and a subset of tasks to
establish precedence (PreT{t}). Parameters were the cycle times of 10 minutes, 30 minutes and 60
minutes; the time to complete each task (d[j in T]), and the cost of completing a task in any particular
station. The costs for this were incremental, to discourage the opening of additional stations unless
needed to produce within the given cycle time. The objective function was set up to minimize the total
number of stations that were opened. The primary constraints ensured that every task is assigned to a
station (TaskAssignment), that each station produces at or below cycle time (CompletionTime), and a
constraint to assure that precedence is respected (Precedence).
(RESULTS)
The Table X shows the results of the linear program as run through the publically available NEOS server.
If cycle time is set at 10 minutes, seven stations are required; with a cycle time of 30 minutes only 3
stations are needed; finally with a cycle of 60 minutes 2 stations are needed. If lower cycle times are
expected, it is recommended that assembly processes be re-evaluated and divided into more
components. The longest manufacturing process is set at 9 minutes; therefore Cycle Times below 9
minutes are currently infeasible. The manufacturing times used
Cycle Time (minutes)
10
30
60
# of Stations Needed
7
3
2


