Drosophila Activity D Lab and Rubric
advertisement
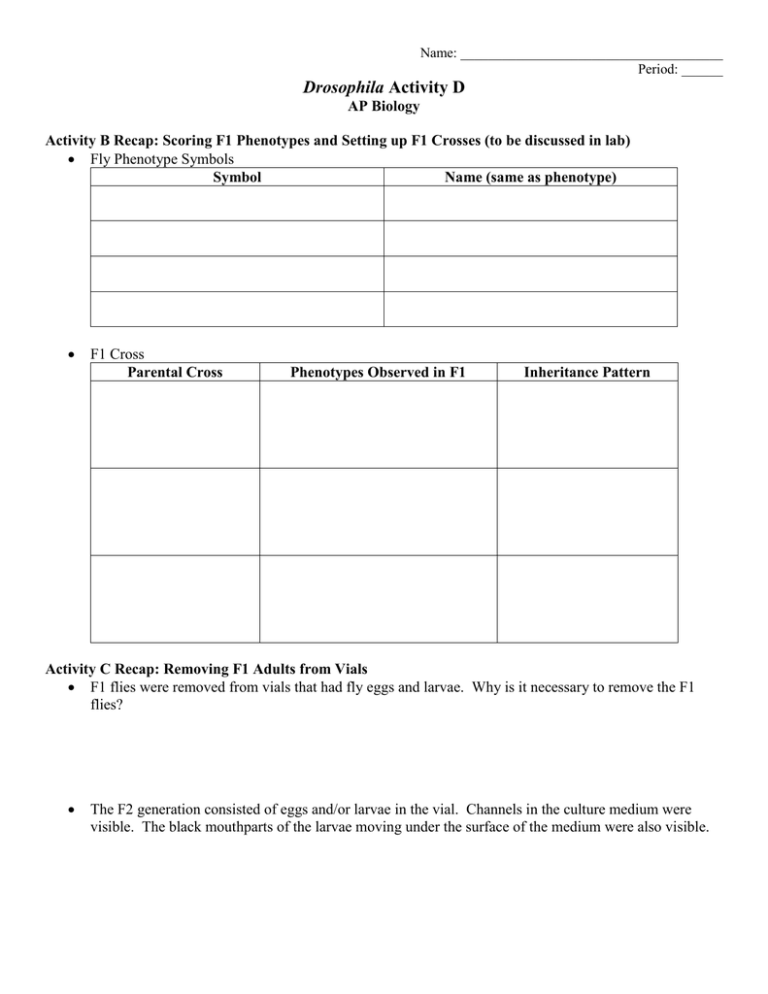
Name: ______________________________________ Period: ______ Drosophila Activity D AP Biology Activity B Recap: Scoring F1 Phenotypes and Setting up F1 Crosses (to be discussed in lab) Fly Phenotype Symbols Symbol Name (same as phenotype) F1 Cross Parental Cross Phenotypes Observed in F1 Inheritance Pattern Activity C Recap: Removing F1 Adults from Vials F1 flies were removed from vials that had fly eggs and larvae. Why is it necessary to remove the F1 flies? The F2 generation consisted of eggs and/or larvae in the vial. Channels in the culture medium were visible. The black mouthparts of the larvae moving under the surface of the medium were also visible. Activity D: Scoring Phenotypes of F2 Flies Materials Sorting brushes Sorting cards Fly morgue Microscope F1 cross vial Fly Nap® Kit Procedure 1. After the F2 adults begin to emerge, score them as to sex and the presence or absence of the phenotypes observed in the parental flies. To do this, transfer the adults to an empty culture vial and anesthesize them using Fly Nap®. Make sure to where gloves while handling Fly Nap®. Do not directly inhale the vapors. Close the Fly Nap® bottle as soon as possible to avoid excess vapors. 2. When the flies are asleep, sprinkle them onto a card or into a petri dish and score them. 3. Record the results in a data table. The more F2 flies collected, the more reliable the data will be. 4. When you have finished scoring the flies, put them in the morgue. Clean-up 1. All Parental, F1, and F2 flies must be disposed of. a. Transfer the adults to an empty culture vial and anesthesize them using Fly Nap®. Make sure to where gloves while handling Fly Nap®. Do not directly inhale the vapors. Close the Fly Nap® bottle as soon as possible to avoid excess vapors. b. Once the flies are asleep, transfer them to the morgue. 2. All petri dishes, sorting cards, and empty F1 cross vials may be thrown in the trash. 3. Wash your hands before you leave lab (especially after handling Fly Nap®). Analysis 1. According to the F1 generation and the pattern of inheritance, what is the expected phenotypic ratio in the F2 offspring? Include a number ratio and a phenotype description ratio (1:2:3 and green eyes: purple eyes: pink eyes). 2. What is the observed phenotypic ratio in the F2 offspring? Include a number ratio and a phenotype description ratio (1:2:3 and green eyes: purple eyes: pink eyes). 3. Perform a chi-square statistical analysis to determine if there is a significant difference between the observed phenotypic ratio and the expected phenotypic ratio. a. Calculate the chi-square value. b. Determine the degrees of freedom. c. Determine the p value. d. Is there a significant difference between the observed phenotypic ratio and the expected phenotypic ratio? Due Date: Tuesday February 16, 2016 (in class) RUBRIC MUST BE STAPLED TO THE FRONT OF YOUR LAB. IF NOT… 10 POINT DEDUCTION. Name: ______________________________________ Period: ______ Genetics of Drosophila Week 3 Lab Report Rubric AP Biology Introduction What knowledge already exists about this subject? a. What is the F1 cross being studied? b. What is the type of inheritance? What is the specific purpose of the study? What were you trying to accomplish the third week in lab? Miscellaneous: spelling, grammar, sentence structure, etc. Maximum Points Data Table Created using a ruler. Maximum Points All columns and rows labeled correctly/clearly. Identifies all possible phenotypes observed in the F2 offspring (if sex-linked, record male and female as phenotypes). Contains the number of F2 offspring that have each phenotype. Analysis According to the F1 generation and the pattern of inheritance, what is the expected phenotypic ratio in the F2 offspring? Number ratio Phenotype description ratio What is the observed phenotypic ratio in the F2 offspring? Number ratio Phenotype description ratio Chi Square Analysis Calculate the chi-square value. Determine the degrees of freedom. Determine the p value (can be an inequality). Is there a significant difference between the observed phenotypic ratio and the expected phenotypic ratio? Shows work!!! Points Earned 10 points 10 points 5 points Points Earned 5 points 5 points 10 points 10 points Maximum Points Points Earned 10 points 10 points 5 points 5 points 5 points 5 points 5 points RUBRIC MUST BE STAPLED TO YOUR LAB (or a 10 POINT DEDUCTION) Total: ______________

