Heartburn Lab.Antacid Lab
advertisement
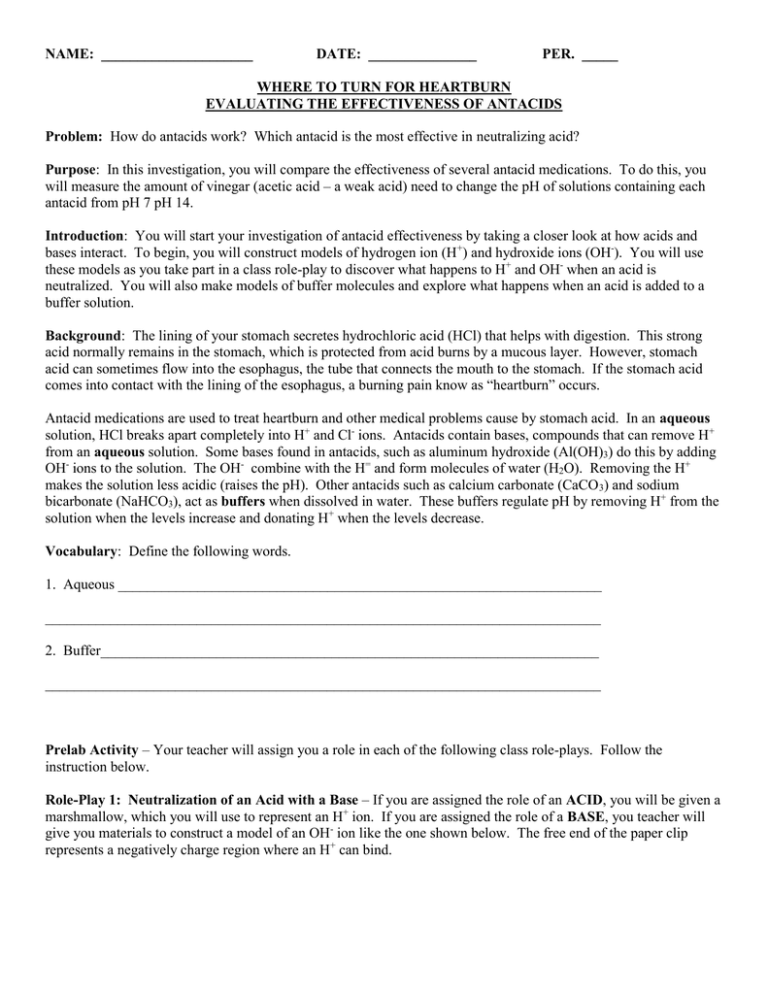
NAME: _____________________ DATE: _______________ PER. _____ WHERE TO TURN FOR HEARTBURN EVALUATING THE EFFECTIVENESS OF ANTACIDS Problem: How do antacids work? Which antacid is the most effective in neutralizing acid? Purpose: In this investigation, you will compare the effectiveness of several antacid medications. To do this, you will measure the amount of vinegar (acetic acid – a weak acid) need to change the pH of solutions containing each antacid from pH 7 pH 14. Introduction: You will start your investigation of antacid effectiveness by taking a closer look at how acids and bases interact. To begin, you will construct models of hydrogen ion (H+) and hydroxide ions (OH-). You will use these models as you take part in a class role-play to discover what happens to H+ and OH- when an acid is neutralized. You will also make models of buffer molecules and explore what happens when an acid is added to a buffer solution. Background: The lining of your stomach secretes hydrochloric acid (HCl) that helps with digestion. This strong acid normally remains in the stomach, which is protected from acid burns by a mucous layer. However, stomach acid can sometimes flow into the esophagus, the tube that connects the mouth to the stomach. If the stomach acid comes into contact with the lining of the esophagus, a burning pain know as “heartburn” occurs. Antacid medications are used to treat heartburn and other medical problems cause by stomach acid. In an aqueous solution, HCl breaks apart completely into H+ and Cl- ions. Antacids contain bases, compounds that can remove H+ from an aqueous solution. Some bases found in antacids, such as aluminum hydroxide (Al(OH)3) do this by adding OH- ions to the solution. The OH- combine with the H= and form molecules of water (H2O). Removing the H+ makes the solution less acidic (raises the pH). Other antacids such as calcium carbonate (CaCO 3) and sodium bicarbonate (NaHCO3), act as buffers when dissolved in water. These buffers regulate pH by removing H+ from the solution when the levels increase and donating H+ when the levels decrease. Vocabulary: Define the following words. 1. Aqueous ___________________________________________________________________ _____________________________________________________________________________ 2. Buffer_____________________________________________________________________ _____________________________________________________________________________ Prelab Activity – Your teacher will assign you a role in each of the following class role-plays. Follow the instruction below. Role-Play 1: Neutralization of an Acid with a Base – If you are assigned the role of an ACID, you will be given a marshmallow, which you will use to represent an H+ ion. If you are assigned the role of a BASE, you teacher will give you materials to construct a model of an OH- ion like the one shown below. The free end of the paper clip represents a negatively charge region where an H+ can bind. Paperclip, Marshmallow, Lifesaver To begin the role-play, students the H+ will gather in a designated area. Students with the models of OH- will move about randomly in another part of the room. Your teacher will “add” two H+ ions at a time to the “solution.” Role-Play 2: Interaction Between Acids and Buffers – If you are assigned the role of an ACID you will be given a marshmallow, which you will use to represent an H+. If you are assigned the role of a BUFFER, you will construct a model of a buffer molecule like the one show below. Straighten three paper clips and twist them around each other. Put three marshmallows on three of the six ends to represent H atoms. The free ends represent negatively charged regions where H+ can bind. 2 Paperclips twisted (taped) together To begin the role-play, students with ions will gather in a designated area. students with buffer molecules will move about randomly in another area of the classroom. Your teacher will “add” on H+ at a time to the “solution.” Pre-lab discussion questions 1. How did your class use the models to represent the interaction between H+ from an acid and OH- from a base? 2. What molecule is formed from H+ and OH-? 3. How did your class use the models to represent the interaction between H+ and buffer molecules? 4. Based on the role plays, what do you predict will happen to the pH of a buffer solution when a small amount of acid is added? Explain. 5. If you keep adding more and more acid to the buffer solution (from question 4), what do you predict will happen to the pH over time? Explain. LAB ACTIVITY – ANTACID TESTING Materials: Antacids Weighing paper Graduated cylinder Pipette Mortar & Pestle Clear plastic cup Water pH paper Balance Marker/pen/pencil Plastic spoon Vinegar Procedure: Part A: Preparing Antacid Solution 1. Crush an antacid table using the mortar & pestle. 2. Measure 1 gram of antacid, using the weighing paper, on the electron balance 3. Label one plastic cup or beaker with the name of the antacid being tested. a. Write this name on Data Table #1 under “Antacid name”. 4. Place the 1 g of antacid into the labeled cup. 5. Ad 100 mL of water to the beaker 6. Mix the solution thoroughly with the spoon/stirring rod, until the antacid is completely dissolved in the water. 7. Using the pH paper, determine the pH of the antacid solution. 8. Record this initial pH in Data Table #1 under the “initial pH” for antacid 1. Part B: Adding Acid to Antacid Solutions 1. 2. 3. 4. 5. Add 10 drops of vinegar to your beaker and stir. Observe the color of the solution . Determine the pH of the solution, using the pH paper. Record the pH in Data Table #1, under the “10 drops” column. Continue to add 10 drops of acid (vinegar) to your solution, stirring each time. a. Measure the pH after each 10 drops and record in the Data Table #1. b. Continue to do this until the pH reaches 4. 6. If at the end of 100 drops, the pH has not reached 4, start to add 20 drops of vinegar, stir and measure the pH. 7. Once your data is completed, test 1 additional antacid and record the date in your table. 8. Clean your lab area. Make sure to wash out the beaker, mortar & pestle & pipette with soap and water. Wipe down your lab tables. Results: Number of drops of vinegar Table #1 ____________________________________________________________________ _________________________________________________________________________________ 1. Make a line graph showing the amount of acid added compared to the pH value for both antacids tested. (2 lines – your data and the shared data). Remember the x-axis shows the independent variable (the one YOU changed during the experiment). The y-axis shows the dependant variable (the one the changed BECAUSE of the independent variable). Make sure you include all of your graphing labels, titles, etc. You will need to go back to your “graphing reference” notes. 2. Collect data from the remaining lab groups that tested different antacids. Record their data in Data Table #2 below, along with the data you collected (all antacids tested should be recorded here). Name of Antacid # of drops of acid added to reach pH 4 Table #2 _________________________________________________________________________ _________________________________________________________________________________ Conclusion 1. Which of the antacids you compared (those graphed) was more effective at neutralizing acid? Explain the results support this conclusion. 2. Of all the antacids tested by your class (Data Table #2), which one was the most effective? Explain why. 3. Acids add H+ to a solution. Antacids contain bases and/or buffers. Write in your own words how antacids neutralize acid (how they work). Be sure to use your knowledge of acids, bases, buffers, neutralization and the pH scale in this answer. 4. Some antacids worked better than others, but all of them eventually lost their effectiveness and allowed the solution to become acidic. what do you think was happening in the antacid solution when the pH started to become acidic? 5. Suggest a reason why some antacids might be more effective than others. Antacid Name Initi al pH 10 20 30 40 50 60 70 80 90 100 120 140 160 No. of drop 180 200 220 240 260 280 300 320 340 360 380 400 420 440 TABLE 1 _____________________________________________________________________________________ _____________________________________________________________________________________________
