Co-regulated transcripts associated to cooperating eSNPs define bi
advertisement
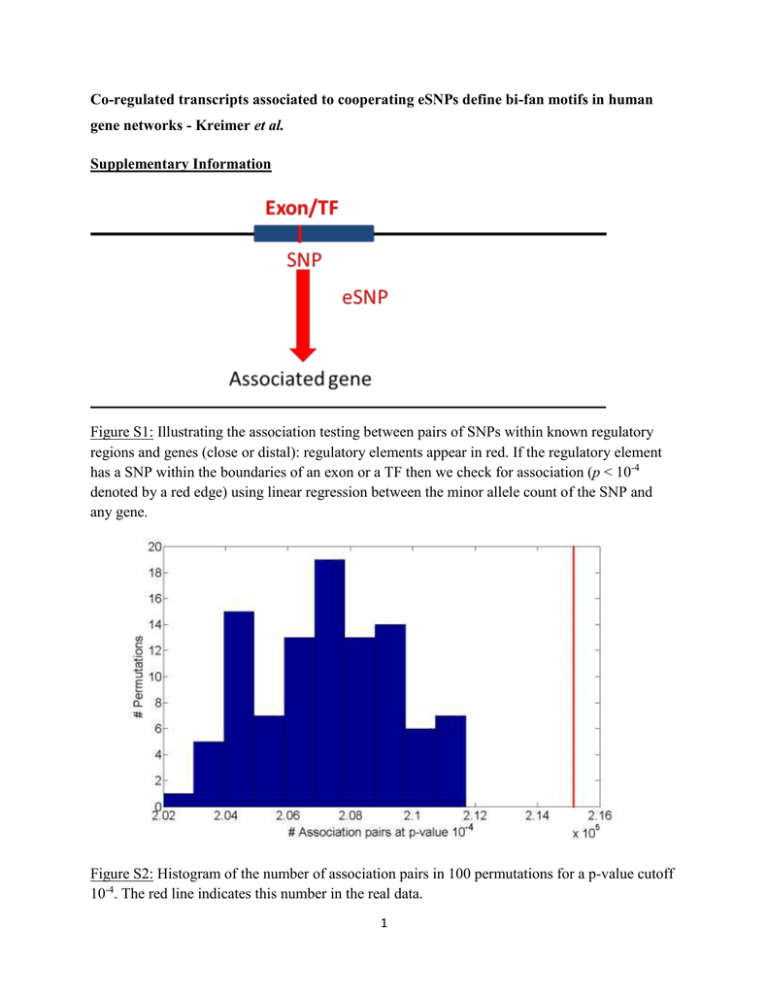
Co-regulated transcripts associated to cooperating eSNPs define bi-fan motifs in human gene networks - Kreimer et al. Supplementary Information Figure S1: Illustrating the association testing between pairs of SNPs within known regulatory regions and genes (close or distal): regulatory elements appear in red. If the regulatory element has a SNP within the boundaries of an exon or a TF then we check for association (p < 10-4 denoted by a red edge) using linear regression between the minor allele count of the SNP and any gene. Figure S2: Histogram of the number of association pairs in 100 permutations for a p-value cutoff 10-4. The red line indicates this number in the real data. 1 Figure S3: Histogram of the number of triplets in 100 permutations, at association p-value of 104 . The red line indicates the observed number of triplets in real data at association p-value 10-4.52. Figure S4: Histogram of the number of quartets in 100 permutations, at association p-value of 104 . The red line indicates the observed number of quartets in real data at association p-value 104.52 . 2 Figure S5: Histogram of the number of filtered quartets in 100 permutations, at association pvalue of 10-4. The red line indicates the observed number of filtered quartets in real data at association p-value 10-4.52. Figure S6: Distribution of genomic properties of eSNP sources in the permuted set: by (a) genomic annotation (b) relative genomic location (c) distances between them and their targets. An eSNP is said to be in cis if it resides within the span of the target gene and in trans otherwise. 3 Figure S7: Dependency structures in quartets of the permuted set: Quartets are either comprised of a pair of mutually independent association signals, one directionally dependent association and one mutually independent association, or a pair of directionally dependent association signals. Figure S8: (a) Direction of effect for eSNP sources association with gene targets expression in (a) real data (b) permutations (c) permutations when the eSNP sources are located on different chromosomes. Both SNPs can have either the same or opposite effect on gene targets. The effect of a SNP on both genes is either the same or opposite. 4 Figure S9: All eight regulation patterns of inconsistent quartets. Note S1: Statistical challenges in comparing real vs. permuted quartets. There are a couple of statistical challenges involved in comparison of real quartets to those observed in permutations. One bias is that of proximal eSNP sources in permutations. This leads for example to the artifact of enrichment of opposite direction eSNP sources in real data, comparing to the proximal, hence correlated effect eSNPs in permutations (Figures S8a and S8b). A second challenge is due to the rarity of eSNP sources on different chromosomes in permutations. This makes it statistically hard for comparing characteristics of sub-groups between real and permuted data (Figures S8c). Table S1: A comprehensive description of 82 cooperating quartets. 3000000000 correspond to different chromosomes. 5 Pop #assoc iations 10-5 #expected associatio ns at 10-5 #filtered quartets EUR 50048 10287 CEU FIN GBR TSI YRI 54232 43111 43396 44562 94671 10155 10334 10267 10251 14698 G1-G2 diff chr (83%) 89% Consist ency (100%) 78% S1 –S2 diff chr (75%) 88% 88% 82% 84% 86% 85% 77% 88% 92% 93% 87% 92% 84% 82% 90% 91% 99.9% 99.7% 99.9% 100% 99.9% Distal regulation (92%) 21674 Same effect of both eSNPs (%64) 82% 43341 16663 18398 16171 51115 99% 90% 98% 93% 96% 99.3% Table S2: Replication of quartets’ properties in the Geuvadis dataset [1]. For each property in the first row we indicate the percentage in the original, smaller dataset. SNP ID rs9274634 Assembled sequences COX:AL662789.11_80240_AC QBL:AL662789.11_80240_AC MANN:AL662789.11_80240_AC MCF:AL662789.11_80240_AC DBB:AL662789.11_53222_GA COX:AL662789.11_53222_GA QBL:AL662789.11_53222_GA MANN:AL662789.11_53222_GA SSTO:AL662789.11_53222_GA MCF:AL662789.11_53222_GA DBB:AL662789.11_53388_GC COX:AL662789.11_53388_GC QBL:AL662789.11_53388_GC MANN:AL662789.11_53388_GC SSTO:AL662789.11_53388_GC MCF:AL662789.11_53388_GC COX:AL662789.11_76776_CT QBL:AL662789.11_76776_CT MANN:AL662789.11_76776_CT DBB:AL662789.11_49324_CG COX:AL662789.11_49324_CG QBL:AL662789.11_49324_CG MANN:AL662789.11_49324_CG SSTO:AL662789.11_49324_CG MCF:AL662789.11_49324_CG DBB:AL662789.11_49391_TC COX:AL662789.11_49391_TC QBL:AL662789.11_49391_TC rs1129740 rs1142334 rs9274389 rs2808143 rs1130034 6 MANN:AL662789.11_49391_TC SSTO:AL662789.11_49391_TC MCF:AL662789.11_49391_TC DBB:AL662789.11_54874_AG COX:AL662789.11_54874_AG QBL:AL662789.11_54874_AG MANN:AL662789.11_54874_AG SSTO:AL662789.11_54874_AG MCF:AL662789.11_54874_AG DBB:AL662789.11_54652_AC COX:AL662789.11_54652_AC QBL:AL662789.11_54652_AC MANN:AL662789.11_54652_AC SSTO:AL662789.11_54652_AC MCF:AL662789.11_54652_AC DBB:AL662789.11_54821_TC COX:AL662789.11_54821_TC QBL:AL662789.11_54821_TC MANN:AL662789.11_54821_TC SSTO:AL662789.11_54821_TC MCF:AL662789.11_54821_TC rs8227 rs1130116 rs9272851 Table S3: The distribution of HLA common variants in specifically assembled sequences. References 1. Lappalainen T, Sammeth M, Friedlander MR, t Hoen PA, Monlong J, et al. (2013) Transcriptome and genome sequencing uncovers functional variation in humans. Nature 501: 506-511. 7
