chapter 9 testing a claim
advertisement
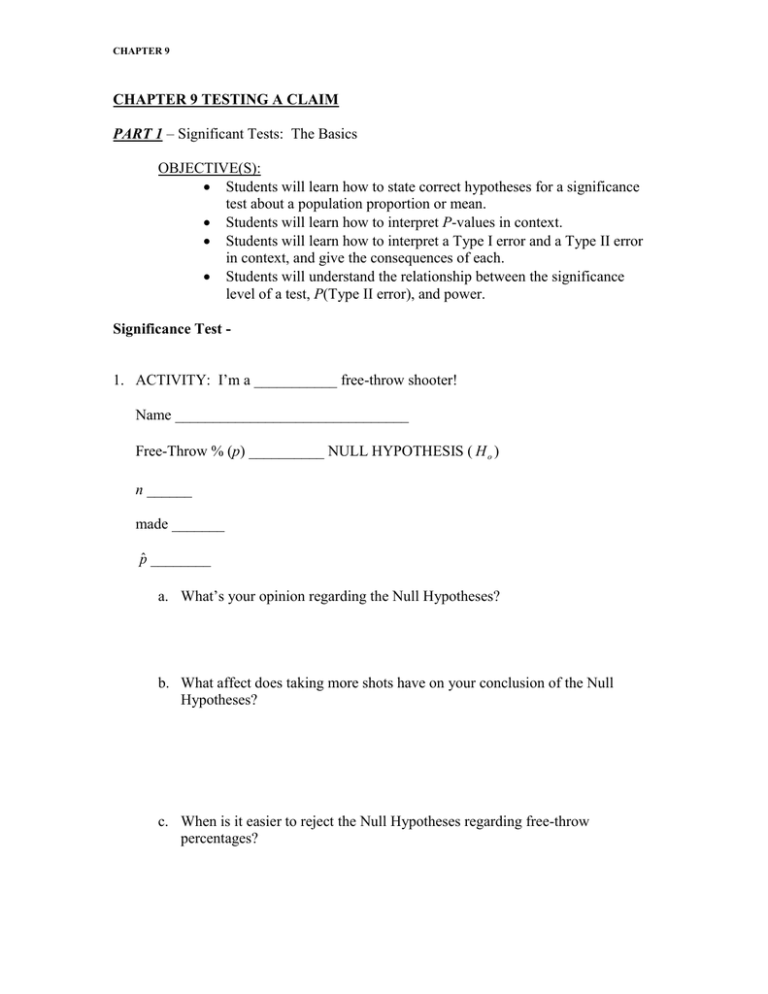
CHAPTER 9 CHAPTER 9 TESTING A CLAIM PART 1 – Significant Tests: The Basics OBJECTIVE(S): Students will learn how to state correct hypotheses for a significance test about a population proportion or mean. Students will learn how to interpret P-values in context. Students will learn how to interpret a Type I error and a Type II error in context, and give the consequences of each. Students will understand the relationship between the significance level of a test, P(Type II error), and power. Significance Test 1. ACTIVITY: I’m a ___________ free-throw shooter! Name _______________________________ Free-Throw % (p) __________ NULL HYPOTHESIS ( H o ) n ______ made _______ p̂ ________ a. What’s your opinion regarding the Null Hypotheses? b. What affect does taking more shots have on your conclusion of the Null Hypotheses? c. When is it easier to reject the Null Hypotheses regarding free-throw percentages? CHAPTER 9 2. Heading into the mayoral election, Jack is feeling fairly confident that he will be elected by obtaining more than 50% of the vote. Suppose that a random sample of 100 voters shows that 56 will vote for Jack. Is his confidence warranted? Maybe. There are actually two possible explanations for why the majority of voters in the sample seem to favor Jack. Null Hypotheses H o - Alternative Hypotheses H a - 3. What is the difference between a one-sided alternative hypothesis and two-sided alternative hypothesis? 4. Mike is an avid golfer who would like to improve his play. A friend suggests getting new clubs and lets Mike try out his 7-iron. Based on years of experience, Mike has established that he mean distance that balls travel when hit with his old 7-iron is =175 yards with a standard deviation of =15 yards. he is hoping that this new club will make his shots with a 7-iron more consistent (less variable), so he goes to the driving range and hits 50 shots with the new 7-iron. a. Describe the parameter of interest in this setting. b. State appropriate hypotheses for performing a significance test. CHAPTER 9 NOTE: To recognize that a problem is calling for a two-sided test, look for key phrases such as “Has the true value changed?” or “Is there convincing evidence that the true value is different?” Also, a question might ask students to “test the claim that = 10” without suggesting a direction for the alternative. In cases like this, it is appropriate to use a two-sided test. On the AP exam, many students incorrectly use sample statistics such as ____ or _____ when stating their hypotheses. We already know the value of the sample statistic – it is the population parameter that we are trying to make an inference about. P-value – c. When Mike was testing a new 7-iron, the hyptheses were H o : 15 H a : 15 where = the true standard deviation of the distances over which Mike hits golf balls using the new 7-iron. Based on 50 shots with the new 7iron, the standard deviation was s x =10.9 yards. A significance test using the sample data produced a P-value of 0.002. i. Interpret the P-value in this context. ii. Do the data provide convincing evidence against the null hypothesis? Explain. CHAPTER 9 5. Was OJ Simpson innocent? a. What were the two hypotheses for the OJ trial? b. Based on the sample of evidence provided, what was the verdict? Statistically Significant – P-value P-value CHAPTER 9 6. For his second semester project in AP Statistics, Zenon decided to investigate whether students at his school prefer name-branded potato chips to generic potato chips. He randomly selected 50 students and had each student try both types of chips, in random order. Overall, 34 of the 50 students preferred the name-brand chips. Zenon performed a significance test using the hypotheses H o : p 0.5 H a : p 0.5 where p = the true proportion of students at his school who prefer name-brand chips. The resulting P- value was 0.0055. What conclusion would you make at each of the following significance levels? a. 0.01 b. 0.001 DAY 1 CHAPTER 9 Type I Error – Type II Error – - fail “II” reject the null hypothesis when they really should. Truth about the population 7. What type of error was committed in the OJ trial (according to popular opinion)? 8. Asked to explain the meaning of “statistically significant at the 0.05 level,” a student says, “This means that the probability that the null hypothesis is true is less than 0.05.” Is this explanation correct? Why or why not? CHAPTER 9 9. The manager of a fast-food restaurant wants to reduce the proportion of drive-through customers who have to wait more than two minutes to receive their food once their order is placed. Based on store records, the proportion of customers who had to wait at least two minutes was p = 0.63. To reduce this proportion, the manager assigns an additional employee to assist with drive-through orders. During the next month, the manager will collect a random sample of drive-through times and test the following hypotheses: H o : p 0.63 H a : p 0.63 where p = the true proportion of drive-through customers who have to wait more than two minutes after their order is placed to receive their food. a. Describe a Type I and Type II error in this setting and explain the consequences of each. Which one is more serious? b. Suppose that the manager decided to carry out this test using a random sample of 250 orders and a significance level of 0.10 . What is the probability of making a Type I error? CHAPTER 9 NOTE: Type I and Type II errors are not mistakes made by a person conducting a test. They are ultimately caused by the variability in the data collection process. Also, the probability of a Type I error and the probability of a Type II error are INVERSELY related. Significance and Type I Error 10. Why don’t we use a very small significance level to reduce the probability of making a Type I error? Power – Power and Type II Error 11. What are three ways to increase the Power? Power = a. b. c. CHAPTER 9 12. You manufacture and sell a liquid product whose electrical conductivity is supposed to be 5. You plan to make 6 measurements of the conductivity of each lot of product. If the product meets specifications, the mean of many measurements will be 5. You will therefore test Ho : 5 Ha : 5 If the true conductivity is 5.1, the liquid is not suitable for its intended use. You learn that the power of your test at the 5% significance level against the alternative =5.1 is 0.23. a. Explain in simple language what “power = 0.23” means in this setting. b. You could get higher power against the same alternative with the same by changing the number of measurements you make. Should you make more measurements or fewer to increase power? c. If you decide to use = 0.10 in place of =0.05, with no other changes in the test, will the power increase or decrease? Justify your answer. d. If you shift your interest to the alternative = 5.2, with no other change, will the power increase or decrease? Justify your answer. DAY 2 CHAPTER 9 PART 2 – Tests about a Population Proportion OBJECTIVE(S): Students will learn how to check conditions for carrying out a test about a population proportion. Students will learn how to conduct a significance test about a population proportion if the conditions are met. Students will learn how to use a confidence interval to draw a conclusion for a two-sided test about a population proportion. 13. Check that the conditions for carrying out a one-sample z test for the population proportion p are met. A Gallup Poll report on a national survey of 1028 teenagers revealed that 72% of teens said they rarely or never argue with their friends. Yvonne wonders whether this national result would be true in her large high school, so she surveys a random sample of 150 students. 14. Explain why we aren’t safe carrying out a one-sample z test for the population proportion p. A college president says, “99% of the alumni support my firing of Coach Boggs.” You contact an SRS of 200 of the college’s 15,000 living alumni to test the hypothesis H o : p 0.99 . CHAPTER 9 Test Statistic – 15. A Gallup Poll report on a national survey of 1028 teenagers revealed that 72% of teens said they rarely or never argue with their friends. Yvonne wonders whether this national result would be true in her large high school, so she surveys a random sample of 150 students. For Yvonne’s survey, 96 students in the sample said they seldom or never argue with friends. a. Calculate the test statistic. b. Find the P-value. Show this result as an area under a standard Normal curve. One-Sample z Test for a Proportion CHAPTER 9 When performing inference tests, beware of the PHANTOMS!!!!! P H A N T O M S 16. On shows like American Idol, contestants often wonder if there is an advantage to performing last. To investigate this, a random sample of 600 American Idol fans is selected to view the audition tapes of 12 never-before-seen contestants. For each fan, the order of the 12 videos is randomly determined. Thus, if the order of performance doesn’t matter, we would expect approximately 1/12 of the fans to prefer the last contestant they view. In this study, 59 of the 600 fans preferred the last contestant they viewed. Do these data provide convincing evidence that there is an advantage to going last? Parameter of interest Hypothesis H0 : Ha : CHAPTER 9 Are the conditions met? Random: Normal: Independent: Name of the test Test of statistic Obtain a P-value. P-value = CHAPTER 9 Make a decision about null State your conclusion ( H a in context of the problem) 17. When the accounting firm Dewey, Cheatem and Howe audits a company’s financial records for fraud, they often use a test based on Benford’s law. Benford’s law states that the distribution of first digits in many real-life sources of data is not uniform. In fact, when there is no fraud, about 30.1% of the numbers in financial records begin with the digit 1.However, if the proportion of first digits that are 1 is significantly different from 0.301 in a random sample of records, Dewey, Cheatem and Howe does a much more thorough investigation of the company. Suppose that a random sample of 300 expenses from a company’s financial records results in only 68 expenses that begin with the digit 1. a. Should Dewey, Cheatem and Howe do a more thorough investigation of this company? Parameter of interest Hypothesis H0 : Ha : CHAPTER 9 Are the conditions met? Random: Normal: Independent: Name of the test Test of statistic Obtain a P-value. P-value = CHAPTER 9 Make a decision about null State your conclusion ( H a in context of the problem) DAY 3 CHAPTER 9 b. Find and interpret a confidence interval for the true proportion of expenses that begin with the digit 1 for the company. Parameter of interest Are the conditions met? Random: Normal: Independent: Name of the interval Interval Conclusion CHAPTER 9 c. Use the interval from part b. to decide whether this company should be investigated for fraud. 18. In a recent year, 73% of first-year college students responding to a national survey identified “being very well-off financially” as an important personal goal. A state university finds that 132 of an SRS of 200 of its first-year students say that this goal is important. Is there good evidence that the proportion of all first-year students at this university who think being very well-off is important differs from the national value, 73%? a. Carry out a test at the 0.05 significance level to help answer this question. Parameter of interest Hypothesis H0 : Ha : CHAPTER 9 Are the conditions met? Random: Normal: Independent: Name of the test Test of statistic Obtain a P-value. P-value = CHAPTER 9 Make a decision about null State your conclusion ( H a in context of the problem) b. Construct and interpret a 95 % confidence interval for the true proportion p of all first-year students at the university who would identify being well-off as an important personal goal. Parameter of interest Are the conditions met? Random: Normal: Independent: CHAPTER 9 Name of the interval Interval Conclusion c. Explain what the interval in part b. tells you about whether the national value holds at this university. 19. What proportion of students are willing to report cheating by other students? A student project put this question to an SRS of 172 undergraduates at a large university: “You witness two students cheating on a quiz. Do you go to the professor?” The Minitab output on p. 564 show the results of a significance test and a 95% confidence interval based on the survey data. a. Define the parameter of interest. CHAPTER 9 b. Check that the conditions for performing the significance test are met in this case. c. Interpret the P-value in context. d. Do these data give convincing evidence that the actual population proportion differs from 0.15? Justify your answer with appropriate evidence. DAY 4 CHAPTER 9 PART 3 – Tests about a Population Mean OBJECTIVE(S): Students will learn how to check conditions for carrying out a test about a population mean. Students will learn how to conduct a one-sample t test about a population mean . Students will learn how to use a confidence interval to draw a conclusion for a two-sided test about a population mean. Students will learn to recognize paired data and use one-sample t procedures to perform significance tests for such data. 20. A classic rock radio station claims to play an average of 50 minutes of music every hour. However, it seems that every time you turn to this station, there is a commercial playing. To investigate their claim, you randomly select 12 different hours during the next week and record what the radio station plays in each of the 12 hours. Here are the number of minutes of music in each of these hours: 44 49 45 51 49 53 49 44 47 50 46 48 a. Check the conditions for carrying out a significance test of the company’s claim that it plays an average of 50 minutes of music per hour. Random Normal Independent CHAPTER 9 b. Compute the test statistic and P-value for these data. H o : 50 H a : 50 21. Find the P-value for a test of a. H o : 10 versus H a : 10 that uses a sample of size 75 and has a test statistic of t = 2.33. b. H o : 10 versus H a : 10 that uses a sample of size 10 and has a test statistic of t = -0.51. 22. What do you do if the df you need isn’t provided in Table B? CHAPTER 9 One-Sample t Test 23. Every road has one at some point – construction zones that have much lower speed limits. To see if drivers obey these lower speed limits, a police officer used a radar gun to measure the speed (in miles per hour, or mph) of a random sample of 10 drivers in a 25 mph construction zone. Here are the results: 27 33 32 21 30 30 29 25 27 34 a. Can we conclude that the average speed of drivers in this construction zone is greater than the posted 25 mph speed limit? Parameter of interest Hypothesis H0 : Ha : CHAPTER 9 Are the conditions met? Random: Normal: Independent: Name of the test Test of statistic Obtain a P-value. P-value = CHAPTER 9 Make a decision about null State your conclusion ( H a in context of the problem) b. Given your conclusion in part a. which kind of mistake – a Type I or a Type II error – could you have made? Explain what this mistake means in this context. 24. In the children’s game Don’t Break the Ice, small plastic ice cubes are squeezed into a square frame. Each child takes turns tapping out a cube of “ice” with a plastic hammer, hoping that the remaining cubes don’t collapse. For the game to work correctly, the cubes must be big enough so that they hold each other in place in the plastic frame but not so big that they are too difficult to tap out. The machine that produces the plastic cubes is designed to make cubes that are 29.5 millimeters(mm) wide, but the actual width varies a little. To ensure that the machine is working well, a supervisor inspects a random sample of 50 cubes every hour and measures their width. The output below summarizes the data from a sample taken during one hour: x 29.4943 mm; n = 50; stdDev ( s x ) = 0.0877121 mm; stdError = 0.0124044 mm CHAPTER 9 a. Interpret the standard deviation and the standard error provided by the computer output. b. Do these data give convincing evidence that the mean width of cubes produced this hour is not 29.5? Parameter of interest Hypothesis H0 : Ha : Are the conditions met? Random: Normal: Independent: CHAPTER 9 Name of the test Test of statistic Obtain a P-value. P-value = Make a decision about null State your conclusion ( H a in context of the problem) DAY 5 CHAPTER 9 c. p. 576 is the Fathom output for a 95% confidence interval for the true mean width of plastic ice cubes produced this hour. i. Interpret the confidence interval. Would you make the same conclusion with the confidence interval as you did with the significance test in part b. ii. Interpret the confidence level. Paired Data – Paired t Procedures – CHAPTER 9 25. For their second semester project in AP Statistics, Libby and Kathryn decided to investigate which line was faster in the supermarket: the express lane or the regular lane. To collect their data, they randomly selected 15 times during a week, went to the same store, and bought the same item. However, one of them used the express lane and the other used a regular lane. To decide which lane each of them would use, they flipped a coin. If it was heads, Libby used the express lane and Kathryn used the regular lane. |If it was tails, Libby used the regular lane and |Kathryn used the express lane. They entered their randomly assigned lanes at the same time, and each recorded the time in seconds it took them to complete the transaction. Carry out a test to see if there is convincing evidence that the express lane is faster. Time in express lane (seconds) 337 226 502 408 151 284 150 357 349 257 321 383 565 363 85 Parameter of interest Hypothesis H0 : Ha : Time in regular lane (seconds) 342 472 456 529 181 339 229 263 332 352 341 397 694 324 127 CHAPTER 9 Are the conditions met? Random: Normal: Independent: Name of the test Test of statistic CHAPTER 9 Obtain a P-value. P-value = Make a decision about null State your conclusion ( H a in context of the problem) 26. What’s the difference between Statistical Significance and Practical Importance? CHAPTER 9 27. Suppose that a large school district implemented a new math curriculum for the current school year. To see if the new curriculum is effective, the district randomly selects 500 students and compares their scores on a standardized test after the curriculum change with their scores on the same test before the curriculum change. The mean improvement was xd 0.9 with a standard deviation of sd 12.0 . a. Calculate the test statistic and P-value for a test of H o : d 0 versus H a : d 0 . b. Are the results significant at the 5% level? c. Can we conclude that the new curriculum is the cause of the apparent increase in scores? CHAPTER 9 28. Suppose you wanted to know the average GPA for students at your school who are enrolled in AP Statistics. Since this isn’t a large population, you conduct a census and record the GPA for each student. Is it appropriate to construct a one-sample t interval for the population mean GPA? 29. Suppose that 20 significance tests were conducted and in each case the null hypothesis was true. What is the probability that we avoid a Type I error in all 20 tests? If we are using a 5% significance level, each individual test has a 0.95 probability of avoiding a Type I error. CHAPTER 9 Chapter 9 Summary INFERENCE TESTING p Parameter of interest Hypothesis H0 : Ha : Are the conditions met? Random: Normal: Independent: Matched Pairs CHAPTER 9 Name of the test Test of statistic Obtain a P-value. P-value = Make a decision about null State your conclusion ( H a in context of the problem) DAY 6


