PPT
advertisement
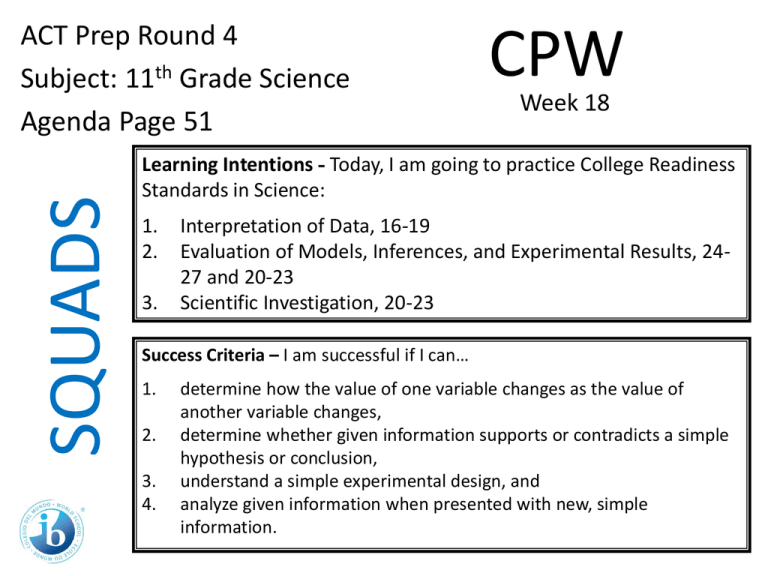
SQUADS ACT Prep Round 4 Subject: 11th Grade Science Agenda Page 51 CPW Week 18 Learning Intentions - Today, I am going to practice College Readiness Standards in Science: 1. 2. 3. Interpretation of Data, 16-19 Evaluation of Models, Inferences, and Experimental Results, 2427 and 20-23 Scientific Investigation, 20-23 Success Criteria – I am successful if I can… 1. 2. 3. 4. determine how the value of one variable changes as the value of another variable changes, determine whether given information supports or contradicts a simple hypothesis or conclusion, understand a simple experimental design, and analyze given information when presented with new, simple information. 11th Grade Science • You have 4 Minutes to read your passage. • You will have 1 minute and 15 seconds to work on each question individually. • You will have 1 minute and 30 seconds to work as a group and write your rationales for each answer. 11th Grade Science 1. According to Figure 1, as the temperature of liquid water decreases from 10°C to 0°C, the density: A. increases only. B. decreases only. C. decreases, then increases. D. increases, then decreases. 11th Grade Science 2. A student claimed that “If the masses of 1 cm3 of a solid and 1 cm3 of any liquid are compared, the mass of the solid will be greater.” Do the data in Table 1 support his claim? A. No; lead has a higher density than any of the liquids listed. B. No; mercury has a higher density than any of the solids listed. C. Yes; lead has a higher density than any of the liquids listed. D. Yes; mercury has a higher density than any of the solids listed. 11th Grade Science 3. Which of the following hypotheses about the relationship between the temperature and the density of a solid is best supported by the data in Figure 2? As the temperature of a solid increases, the density of the solid: A. increase only. B. decreases only. C. increases, then decreases. D. decreases, then increases. 11th Grade Science 4. Equal amounts of ethyl ether, mercury, and water (density = 0.9971 g/cm3) at 25°C are poured into a single beaker. Three distinct layers of liquid form in the beaker. Based on the data in Table 1, which of the following diagrams represents the order, from top to bottom, of the liquids in the beaker? SQUADS ACT Prep Round 4 Subject: 11th Grade Science Agenda Page 51 CPW Week 18 Now ‘Squad Up’ and replay this PPT. Use the Student Answer/Rationale Sheet. Then exchange your Squad’s answer sheet with that of another squad. Launch the ANSWERS video.
