(Rhamnus cathartica) on a Floodplain Forest in Sioux County, Iowa
advertisement
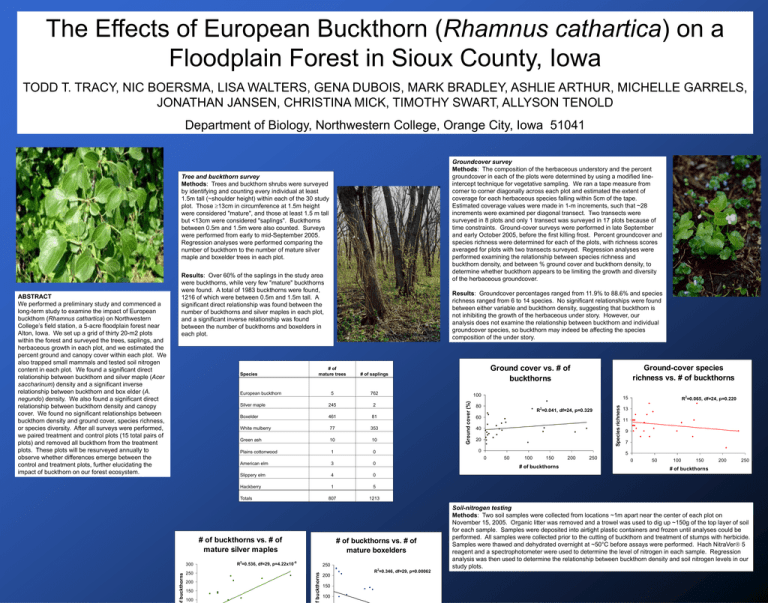
The Effects of European Buckthorn (Rhamnus cathartica) on a Floodplain Forest in Sioux County, Iowa TODD T. TRACY, NIC BOERSMA, LISA WALTERS, GENA DUBOIS, MARK BRADLEY, ASHLIE ARTHUR, MICHELLE GARRELS, JONATHAN JANSEN, CHRISTINA MICK, TIMOTHY SWART, ALLYSON TENOLD Department of Biology, Northwestern College, Orange City, Iowa 51041 Groundcover survey Methods: The composition of the herbaceous understory and the percent groundcover in each of the plots were determined by using a modified lineintercept technique for vegetative sampling. We ran a tape measure from corner to corner diagonally across each plot and estimated the extent of coverage for each herbaceous species falling within 5cm of the tape. Estimated coverage values were made in 1-m increments, such that ~28 increments were examined per diagonal transect. Two transects were surveyed in 8 plots and only 1 transect was surveyed in 17 plots because of time constraints. Ground-cover surveys were performed in late September and early October 2005, before the first killing frost. Percent groundcover and species richness were determined for each of the plots, with richness scores averaged for plots with two transects surveyed. Regression analyses were performed examining the relationship between species richness and buckthorn density, and between % ground cover and buckthorn density, to determine whether buckthorn appears to be limiting the growth and diversity of the herbaceous groundcover. Tree and buckthorn survey Methods: Trees and buckthorn shrubs were surveyed by identifying and counting every individual at least 1.5m tall (~shoulder height) within each of the 30 study plot. Those 13cm in circumference at 1.5m height were considered "mature", and those at least 1.5 m tall but <13cm were considered "saplings". Buckthorns between 0.5m and 1.5m were also counted. Surveys were performed from early to mid-September 2005. Regression analyses were performed comparing the number of buckthorn to the number of mature silver maple and boxelder trees in each plot. Results: Groundcover percentages ranged from 11.9% to 88.6% and species richness ranged from 6 to 14 species. No significant relationships were found between either variable and buckthorn density, suggesting that buckthorn is not inhibiting the growth of the herbaceous under story. However, our analysis does not examine the relationship between buckthorn and individual groundcover species, so buckthorn may indeed be affecting the species composition of the under story. # of saplings 5 762 European buckthorn Silver maple 245 2 Boxelder 461 81 White mulberry 77 353 Green ash 10 10 Plains cottonwood 1 0 100 3 Slippery elm 4 0 Hackberry 1 5 807 1213 Totals # of buckthorns vs. # of mature silver maples 250 200 150 100 # of buckthorns vs. # of mature boxelders R2=0.536, df=29, p=4.22x10⁻⁶ 250 f buckthorns 300 0 200 150 100 R2=0.346, df=29, p=0.00062 R2=0.065, df=24, p=0.220 15 80 R2=0.041, df=24, p=0.329 60 40 20 0 13 11 9 7 5 0 American elm Ground-cover species richness vs. # of buckthorns Ground cover vs. # of buckthorns Species richness # of mature trees Ground cover (%) Species f buckthorns ABSTRACT We performed a preliminary study and commenced a long-term study to examine the impact of European buckthorn (Rhamnus cathartica) on Northwestern College’s field station, a 5-acre floodplain forest near Alton, Iowa. We set up a grid of thirty 20-m2 plots within the forest and surveyed the trees, saplings, and herbaceous growth in each plot, and we estimated the percent ground and canopy cover within each plot. We also trapped small mammals and tested soil nitrogen content in each plot. We found a significant direct relationship between buckthorn and silver maple (Acer saccharinum) density and a significant inverse relationship between buckthorn and box elder (A. negundo) density. We also found a significant direct relationship between buckthorn density and canopy cover. We found no significant relationships between buckthorn density and ground cover, species richness, or species diversity. After all surveys were performed, we paired treatment and control plots (15 total pairs of plots) and removed all buckthorn from the treatment plots. These plots will be resurveyed annually to observe whether differences emerge between the control and treatment plots, further elucidating the impact of buckthorn on our forest ecosystem. Results: Over 60% of the saplings in the study area were buckthorns, while very few "mature" buckthorns were found. A total of 1983 buckthorns were found, 1216 of which were between 0.5m and 1.5m tall. A significant direct relationship was found between the number of buckthorns and silver maples in each plot, and a significant inverse relationship was found between the number of buckthorns and boxelders in each plot. 50 100 150 # of buckthorns 200 250 0 50 100 150 200 250 # of buckthorns Soil-nitrogen testing Methods: Two soil samples were collected from locations ~1m apart near the center of each plot on November 15, 2005. Organic litter was removed and a trowel was used to dig up ~150g of the top layer of soil for each sample. Samples were deposited into airtight plastic containers and frozen until analyses could be performed. All samples were collected prior to the cutting of buckthorn and treatment of stumps with herbicide. Samples were thawed and dehydrated overnight at ~50°C before assays were performed. Hach NitraVer 5 reagent and a spectrophotometer were used to determine the level of nitrogen in each sample. Regression analysis was then used to determine the relationship between buckthorn density and soil nitrogen levels in our study plots. # of buckt Soil nitrogen level vs. # of buckthorns 100 50 0 RESEARCH HYPOTHESES We hypothesized that European buckthorn (Rhamnus cathartica) would both directly (via direct competition) and indirectly (via allelopathy and chemical changes in the soil) affect the composition of the forest understory, and we predicted decreased ground cover and altered soil nitrogen content in areas of our forest with higher buckthorn density. We also predicted that groundcover density and diversity, soil nitrogen levels, and habitat use by deer mice would relate to buckthorn density. We also hypothesized that European buckthorn would exhibit certain habitat "preferences" and predicted that buckthorn density would relate to the openness of the canopy and the species composition of the mature trees in our study plots. 0 10 20 30 40 9 Soil nitrogen (ppm) # of mature silver maples Canopy cover Methods: Mean percent canopy cover was determined for each plot by using a spherical canopy densiometer to take measurements from the center of each plot while facing all 4 compass directions. Canopy measurements were made on October 4, 2005. Regression analysis was performed to examine the relationship between numbers of young buckthorn (0.5m height < 1.5m) and % canopy cover to determine whether canopy cover might affect recruitment of buckthorn in the plots. 8 R2=0.163, df=17, p=0.097 7 6 5 4 3 0 50 100 150 200 Canopy cover vs. number of mature boxelders DISCUSSION--European buckthorn and glossy buckthorn (R. frangula) are invasive plant species initially imported to the U.S. in 1849 as ornamental shrubs. Researchers throughout the Eastern U.S. have found various negative ecological effects of buckthorn (e.g., increased nest predation in songbirds, Schmidt & Whelan 1999; increased soil nitrogen content, Heneghan et al. 2004; decreased herbaceous groundcover, Boudreau & Wilson 1992; decreased juvenile recruitment by canopy trees, Fagan & Peart 2004). Since the effects found in one area of the U.S. or in one habitat may not be the same as those found in others, studies that specifically examine the local habitat preferences of European buckthorn and the impact of buckthorn on Iowa’s native landscape seem appropriate and warranted, particularly if much effort and expense is being invested in removing and controlling the shrub. # of young buckthorns (height < 1.5m) vs. % canopy cover Canopy cover vs. # of mature silver maples R2=0.275, df=29, p=0.0029 100 200 90 80 # of young buckthorns Canopy cover (%) 95 90 85 80 75 70 65 60 55 50 R2=0.27, df=29, p=0.0032 70 60 50 10 20 30 # of mature boxelders 40 R2=0.241, df=29, p=0.0058 150 100 50 0 0 10 20 30 40 50 60 # of mature silver maples 70 80 90 Canopy cover (%) Mammal trapping Methods: A Sherman trap baited with oatmeal and a carrot chunk was placed at the center of each of the 30 plots. Traps were checked daily between 8 and 10 a.m. for the duration of the study. To facilitate individual identification upon recapture, captured deer mice were uniquely marked inside their earflaps and beneath their armpits with a combination of red, black, and blue Sharpie markers and were released at the point of capture. All captures and recaptures were recorded. Mammal trapping commenced on October 25, 2005, and extended over the next 4 nights. Regression analysis was performed comparing the number of deer mice captured in each plot (excluding recaptures within the same plot) to the total number of buckthorn in each plot to determine whether buckthorn density relates to habitat use by deer mice. # of mice captured within plot vs. # of buckthorns 4 R2=0.0028, df=29, p=0.782 3 Results: Deer mice were the only mammals captured, although a few traps showed signs of squirrel activity. Eleven different mice were trapped in a total of 15 plots over the 4-day period. No significant relationship between deer mouse activity and buckthorn density was found. # of mice 0 250 Total # of buckthorns Results: A significant direct relationship was found between numbers of young buckthorn and % canopy cover. It appears that buckthorn are more readily recruited into shadier areas of the forest. However, canopy cover was also found to be significantly directly related to silver maple density and significantly inversely related to boxelder density, so the purported relationship between buckthorn recruitment and shading may simply reflect an effect of the species composition of the forest overstory. Furthermore, there were signs that the boxelder trees had begun losing some leaves by the time we took canopy measurements, so we plan to take canopy measurements earlier in the season in 2006 in order to verify the relationships detected in our 2005 study. Canopy cover (%) DESCRIPTION OF STUDY AREA Northwestern College's forest is a 5-acre floodplain forest along the Floyd River, near Alton, Iowa. This is a secondary successional forest on a land that produced corn as recently as 1968. The land was disked and seeded with prairie seeds in 1969, and small trees were hand-planted in much of the area in the early 1970's. None of the early plantings survived, and virtually all of the present-day trees in the forest originated as seeds blown in from nearby areas. The forest canopy is dominated by silver maple (Acer saccharinum), boxelder (A. negundo), white mulberry (Morus alba), and green ash (Fraxinus pennsylvanica), with European buckthorn (Rhamnus cathartica) and small black currant (Ribes nigrum) shrubs dominating a patchy woody understory. The heterogeneous groundcover is dominated by wood nettle (Laportea canadensis), Virginia waterleaf (Hydrophyllum virginianum), creeping Charlie (Glechoma bederacea), reed canarygrass (Phalaris arundinacea), and black snakeroot (Cimicifuga racemosa). Within the forest, the corners of thirty 20-m2 plots have been demarcated with numbered iron fence posts permanently pounded into the ground. 150 2 1 0 0 50 100 150 # of buckthorns 200 250 100 In our study, we found that buckthorn density was directly related to maple density and inversely related to boxelder density. These relationships may reflect a more hospitable environment for buckthorn recruitment beneath maples than boxelders, or they may simply reflect a spurious relationship reflecting similar locations of seed sources for maple and buckthorn. There is no evidence that buckthorn is negatively impacting the herbaceous groundcover of our forest, although a more in-depth analysis of groundcover composition is warranted. A virtually significant inverse relationship was found between soil nitrogen levels and buckthorn density, although it is unclear whether this relationship reflects a change effected by buckthorn or simply that buckthorn recruitment is higher in areas with higher soil-nitrogen levels. Finally, we found no evidence that buckthorn is influencing habitat use by deer mice. Since the majority of buckthorns in our study are quite young, it is possible that differences between high- and low- density areas have not yet emerged. To determine the longer-term effects of buckthorn, we have commenced a long-term study within our forest by pairing treatment and control plots with similar buckthorn and tree composition and removing all buckthorn from treatment plots, with the goal of resurveying the plots annually. We are currently surveying the invertebrates collected in soil samples from our plots, and we are studying the predation rates of artificial nests set up in buckthorns vs. tree saplings. Results of these studies will help us more fully understand the potential ecological impact of European buckthorn and help Iowans understand the extent to which the invasive shrub imperils our native forests. REFERENCES Boudreau, D and G. Wilson. 1992. Buckthorn research and control at Pipestone National Monument. Restoration & Management Notes 10: 94-95. Fagan, M. & D. Peart. 2004. Impact of the invasive shrub glossy buckthorn (Rhamnus frangula) on juvenile recruitment by canopy trees. Forest Ecology and Management 194:95-107. Heneghan, L., Clay, C., & Brundage, C. 2002. Rapid decomposition of buckthorn litter may change soil nutrient levels. Ecological Restoration 20(2):108-111. Schmidt, K. & C. Whelan. 1999. Effects of exotic Lonicera and Rhamnus on songbird nest predation. Conservation Biology 13:1502-1506.
