Latihan soal MPC II Praktikum Murthy #354 9.2 In a sample survey
advertisement
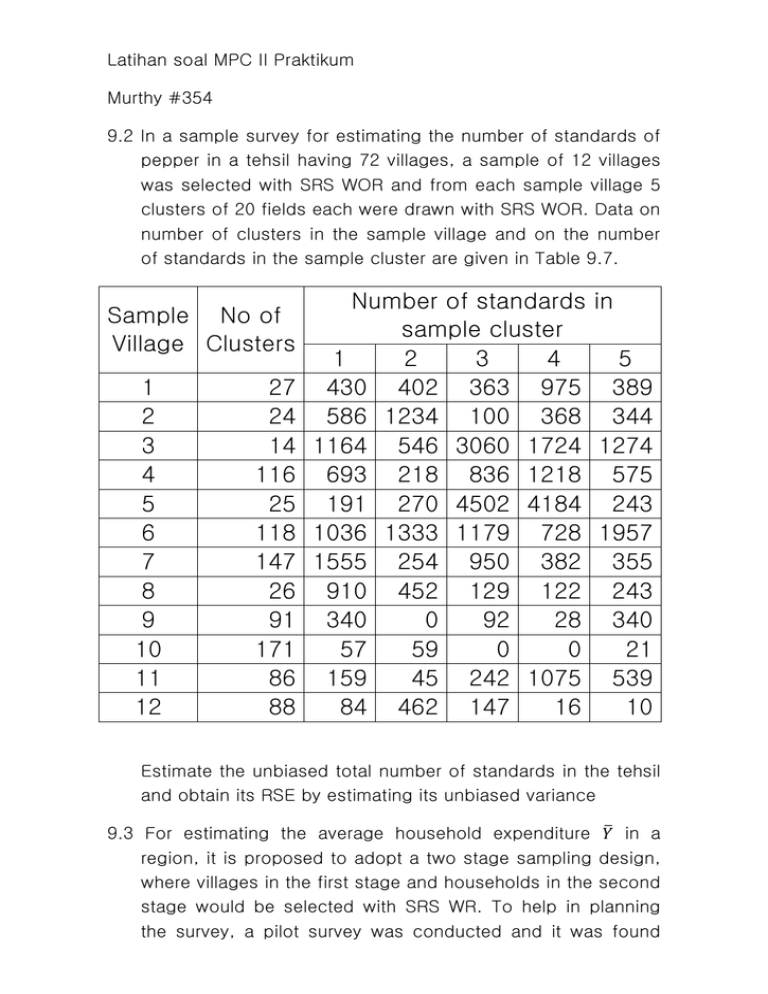
Latihan soal MPC II Praktikum Murthy #354 9.2 In a sample survey for estimating the number of standards of pepper in a tehsil having 72 villages, a sample of 12 villages was selected with SRS WOR and from each sample village 5 clusters of 20 fields each were drawn with SRS WOR. Data on number of clusters in the sample village and on the number of standards in the sample cluster are given in Table 9.7. Sample No of Village Clusters 1 2 3 4 5 6 7 8 9 10 11 12 27 24 14 116 25 118 147 26 91 171 86 88 Number of standards in sample cluster 1 2 3 4 5 430 402 363 975 389 586 1234 100 368 344 1164 546 3060 1724 1274 693 218 836 1218 575 191 270 4502 4184 243 1036 1333 1179 728 1957 1555 254 950 382 355 910 452 129 122 243 340 0 92 28 340 57 59 0 0 21 159 45 242 1075 539 84 462 147 16 10 Estimate the unbiased total number of standards in the tehsil and obtain its RSE by estimating its unbiased variance 9.3 For estimating the average household expenditure 𝑌̅ in a region, it is proposed to adopt a two stage sampling design, where villages in the first stage and households in the second stage would be selected with SRS WR. To help in planning the survey, a pilot survey was conducted and it was found that a) estimate of 𝑌̅ is 50 b) estimate of between-village variation 𝜎𝑏 2 = 85.5 c) estimate of between-household variation within villages 𝜎𝑤 2 = 36.5 d) cost of travel, etc 𝐶1 = 𝑅𝑠 . 9 e) cost of survey per household 𝐶2 = 𝑅𝑒 . 1 . Using this information and assuming the overhead cost to be 𝑅𝑠 . 1000 , determine the optimum number of sample villages and number of households to be sampled per sample village, when the total cost is fixed at (i) 𝑅𝑠 . 5000 (ii) 𝑅𝑠 . 10000 (iii) 𝑅𝑠 . 50000 . Also calculate the minimum RSE’s attained in the three cases. 9.6 It is proposed to draw a sample of n clusters of M units each from a population of N clusters an a sub sample of m units from each sample cluster using SRS WR at both the stage for estimating the mean per unit of a specified characteristic. (i)Assuming the cost function to be of the form C=Co+C1n+C2mn Determine the optimum values of m and n when C is fixed at C’ (ii)Given that C’=1000, Co=300, C1=9, and C2=1 (in rupees), find the optimum values of m and n using the following analysis of variance table Table 9.10 ANALYSIS OF VARIANCE FOR THE STUDY VARIABLE Source of variation (1) Degrees of freedom (2) Sum of squares Mean squares (3) (4) 20 ∑(𝑌̅𝑖 − 𝑌̅)2 180.9 90 Between clusters 89 Within clusters 1710 𝑖=1 90 20 ∑ ∑(𝑌𝑖𝑗 − 𝑌̅𝑖 ) 2 49.5 𝑖=1 𝑗=1 90 20 Total 1799 2 ∑ ∑(𝑌𝑖𝑗 − 𝑌̅) 56.0 𝑖=1 𝑗=1 (total number of clusters : 90, number of units in a cluster : 20) 9.7 For estimating the total yield of paddy (Y) in a district, a stratified two stage sampling design was adopted, where 4 villages were selected from each stratum, with PPS WR, size being geographical area, and 4 plots were drawn from each sample villages circular systematically for ascertaining the yield of paddy. Using the information given in 9.11, estimate unbiased Y and obtain an estimate of its RSE. Table 9.11 YIELD OF PADDY FOR THE SAMPLE PLOTS Stratum Sample village Invers of probability Total no of plots Yield of paddy (in kilogrammes) 28 14 240 76 1 (5) 104 108 100 346 2 (6) 182 64 115 350 3 (7) 148 132 50 157 4 (8) 87 156 172 119 (1) 1 (2) 1 2 3 4 (3) 440.21 660.43 31.50 113.38 (4) 2 1 2 3 4 21.00 16.80 24.76 49.99 256 288 222 69 124 123 264 300 111 177 78 114 135 106 144 68 216 138 55 111 3 1 2 3 4 67.68 339.14 100.00 68.07 189 42 134 161 110 80 121 243 281 61 212 116 120 118 174 314 114 124 106 129


