43_patterns_and_nonlinear_functions
advertisement
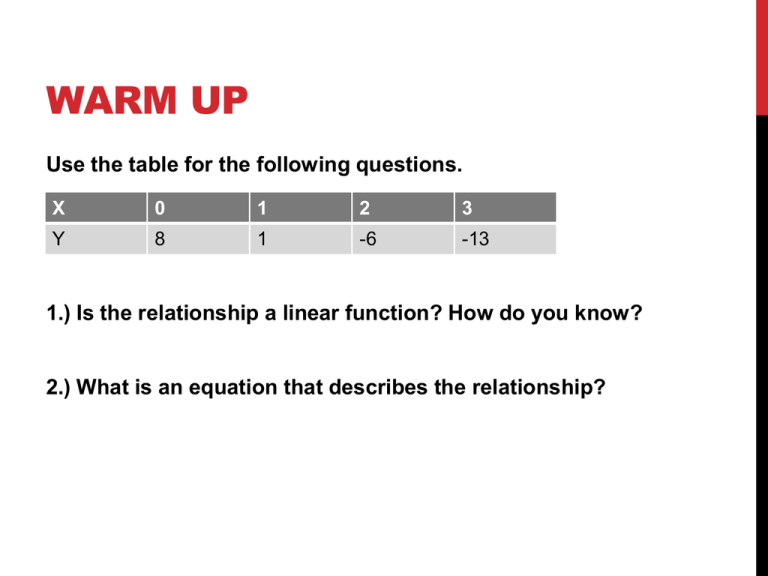
WARM UP Use the table for the following questions. X 0 1 2 3 Y 8 1 -6 -13 1.) Is the relationship a linear function? How do you know? 2.) What is an equation that describes the relationship? 4.3 PATTERNS AND NONLINEAR FUNCTIONS OBJECTIVE Identify and represent patterns that describe nonlinear functions. LINEAR AND NONLINEAR EXAMPLE 1 – CLASSIFYING FUNCTIONS AS LINEAR OR NONLINEAR The number of centimeters is a function of the number of inches as shown in the table. Is the function linear or nonlinear? Inches Centimeters 1 2.54 2 5.08 3 7.62 4 10.16 EXAMPLE 2 – REPRESENTING PATTERNS AND NONLINEAR FUNCTIONS The table shows the number of calls made in a phone tree during each level. Identify the pattern to complete the table. How can you represent the relationship using words, an equation, and a graph? Level, x Number of calls, y Ordered Pair (x, y) 1 2 (1, 2) 2 4 (2, 4) 3 8 (3, 8) EXAMPLE 3 – WRITING A RULE TO DESCRIBE A NONLINEAR FUNCTION The ordered pairs (1, 1), (2, 8), (3, 27), (4, 64), and (5, 125) represent a function. What is a rule that represents this function? ASSIGNMENT Pg. 250 (6 – 9 all, 12, 13, 15) QUIZ Evaluate the expression for the given value(s) of the variable(s). 1.) 3x – 2y; x = -1, y =2 2.) w² + 3w; w = -3 3.) 3+𝑘 𝑘 ;k=3 4.) Is the relationship in the table a linear function? Describe the relationship using an equation. x 1 2 3 4 y 8 10 12 14


