Statistics Lab: Normal Distributions & CLT
advertisement
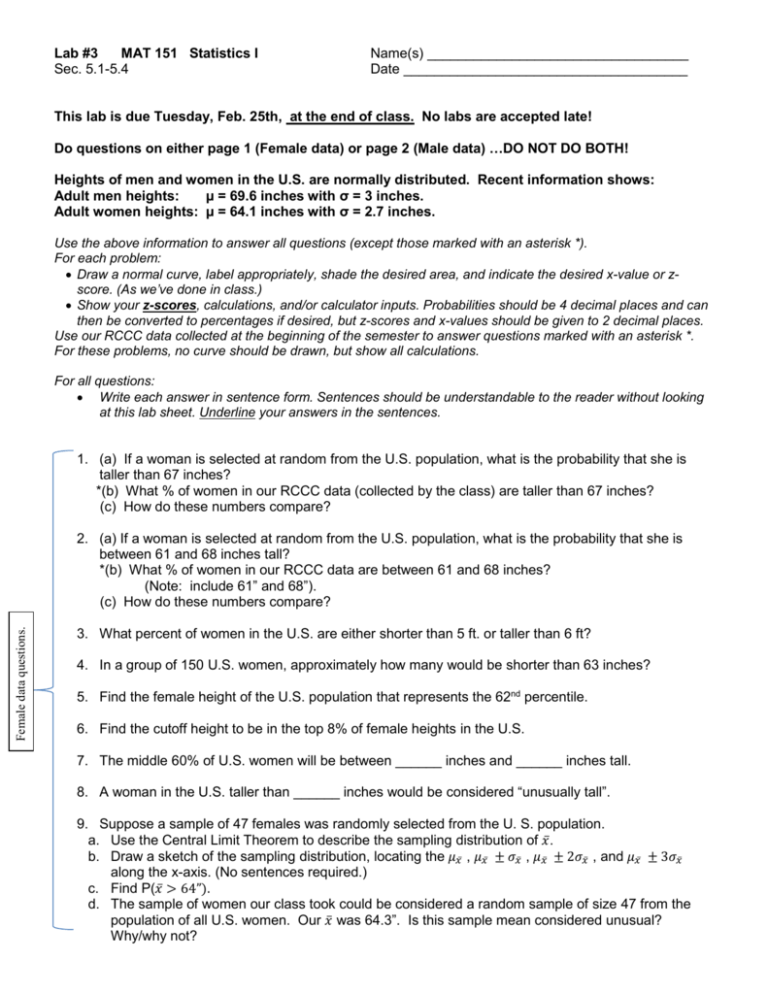
Lab #3 MAT 151 Statistics I Sec. 5.1-5.4 Name(s) __________________________________ Date _____________________________________ This lab is due Tuesday, Feb. 25th, at the end of class. No labs are accepted late! Do questions on either page 1 (Female data) or page 2 (Male data) …DO NOT DO BOTH! Heights of men and women in the U.S. are normally distributed. Recent information shows: Adult men heights: µ = 69.6 inches with σ = 3 inches. Adult women heights: µ = 64.1 inches with σ = 2.7 inches. Use the above information to answer all questions (except those marked with an asterisk *). For each problem: Draw a normal curve, label appropriately, shade the desired area, and indicate the desired x-value or zscore. (As we’ve done in class.) Show your z-scores, calculations, and/or calculator inputs. Probabilities should be 4 decimal places and can then be converted to percentages if desired, but z-scores and x-values should be given to 2 decimal places. Use our RCCC data collected at the beginning of the semester to answer questions marked with an asterisk *. For these problems, no curve should be drawn, but show all calculations. For all questions: Write each answer in sentence form. Sentences should be understandable to the reader without looking at this lab sheet. Underline your answers in the sentences. 1. (a) If a woman is selected at random from the U.S. population, what is the probability that she is taller than 67 inches? *(b) What % of women in our RCCC data (collected by the class) are taller than 67 inches? (c) How do these numbers compare? Female data questions. 2. (a) If a woman is selected at random from the U.S. population, what is the probability that she is between 61 and 68 inches tall? *(b) What % of women in our RCCC data are between 61 and 68 inches? (Note: include 61” and 68”). (c) How do these numbers compare? 3. What percent of women in the U.S. are either shorter than 5 ft. or taller than 6 ft? 4. In a group of 150 U.S. women, approximately how many would be shorter than 63 inches? 5. Find the female height of the U.S. population that represents the 62nd percentile. 6. Find the cutoff height to be in the top 8% of female heights in the U.S. 7. The middle 60% of U.S. women will be between ______ inches and ______ inches tall. 8. A woman in the U.S. taller than ______ inches would be considered “unusually tall”. 9. Suppose a sample of 47 females was randomly selected from the U. S. population. a. Use the Central Limit Theorem to describe the sampling distribution of 𝑥̅ . b. Draw a sketch of the sampling distribution, locating the 𝜇𝑥̅ , 𝜇𝑥̅ ± 𝜎𝑥̅ , 𝜇𝑥̅ ± 2𝜎𝑥̅ , and 𝜇𝑥̅ ± 3𝜎𝑥̅ along the x-axis. (No sentences required.) c. Find P(𝑥̅ > 64”). d. The sample of women our class took could be considered a random sample of size 47 from the population of all U.S. women. Our 𝑥̅ was 64.3”. Is this sample mean considered unusual? Why/why not? Male data Questions 10. (a) What percent of U.S. men are 6 ft. or shorter? *(b) What % of men in our RCCC data (collected by the class) are 6 ft. or shorter? (c) How do these numbers compare? 11. (a) If a man is selected at random from the U.S. population, what is the probability that he is between 66 and 71 inches tall? *(b) What % of men in our RCCC data are between 66 and 71 inches? (Note: include 66” and 71”). (c) How do these numbers compare? Male data questions. 12. Find the probability that a male in the U.S. is shorter than 5 ft. or taller than 6ft. 13. In a group of 120 males, approximately how many would be taller than 67 inches? 14. Find the male height that represents the 62nd percentile. 15. Find the cutoff height to be in the top 8% of male heights. 16. The middle 60% of men are between ___________ inches and _________ inches tall. 17. In the U.S., males shorter than _____ inches would be considered “unusually short”? 18. Suppose a sample of 33 males was randomly selected from the U. S. population. a. Use the Central Limit Theorem to describe the sampling distribution of 𝑥̅ . b. Draw a sketch of the sampling distribution, locating the 𝜇𝑥̅ , 𝜇𝑥̅ ± 𝜎𝑥̅ , 𝜇𝑥̅ ± 2𝜎𝑥̅ , and 𝜇𝑥̅ ± 3𝜎𝑥̅ along the x-axis. (No sentences required.) c. Find P(𝑥̅ >69). d. The sample of men our class took could be considered a random sample of size 33 from the population of all U.S. men. Our 𝑥̅ was 69.6”. Is this sample mean considered unusual? Why/why not?

