The source of increasing opportunity cost rests with resource
advertisement

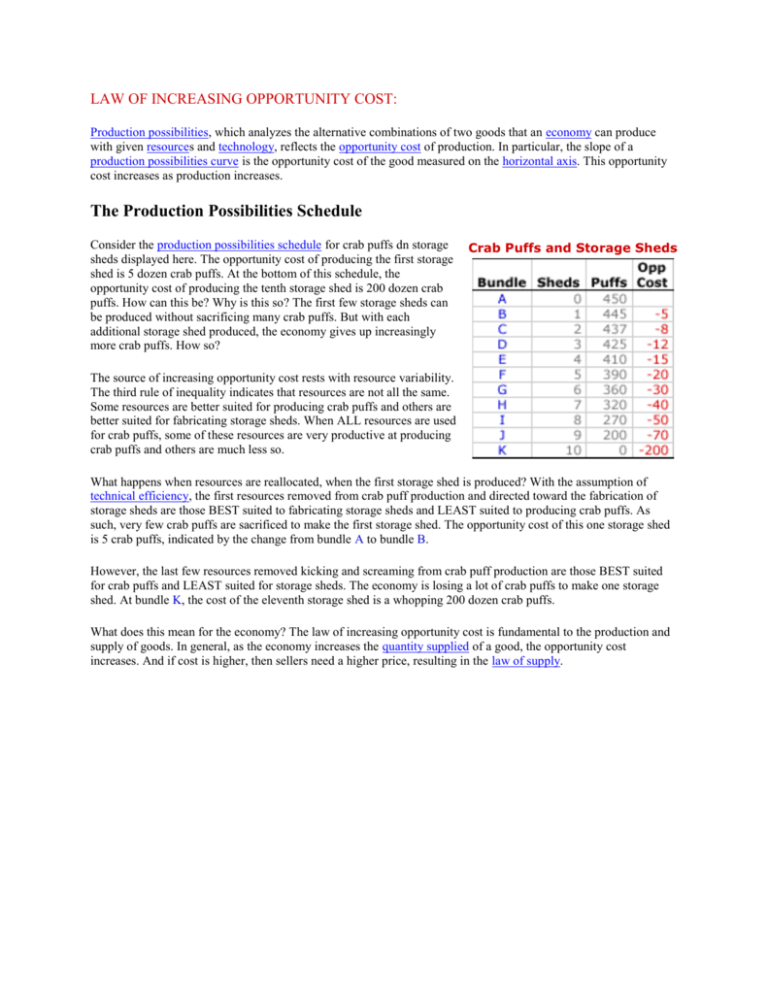
LAW OF INCREASING OPPORTUNITY COST: Production possibilities, which analyzes the alternative combinations of two goods that an economy can produce with given resources and technology, reflects the opportunity cost of production. In particular, the slope of a production possibilities curve is the opportunity cost of the good measured on the horizontal axis. This opportunity cost increases as production increases. The Production Possibilities Schedule Consider the production possibilities schedule for crab puffs dn storage sheds displayed here. The opportunity cost of producing the first storage shed is 5 dozen crab puffs. At the bottom of this schedule, the opportunity cost of producing the tenth storage shed is 200 dozen crab puffs. How can this be? Why is this so? The first few storage sheds can be produced without sacrificing many crab puffs. But with each additional storage shed produced, the economy gives up increasingly more crab puffs. How so? Crab Puffs and Storage Sheds The source of increasing opportunity cost rests with resource variability. The third rule of inequality indicates that resources are not all the same. Some resources are better suited for producing crab puffs and others are better suited for fabricating storage sheds. When ALL resources are used for crab puffs, some of these resources are very productive at producing crab puffs and others are much less so. What happens when resources are reallocated, when the first storage shed is produced? With the assumption of technical efficiency, the first resources removed from crab puff production and directed toward the fabrication of storage sheds are those BEST suited to fabricating storage sheds and LEAST suited to producing crab puffs. As such, very few crab puffs are sacrificed to make the first storage shed. The opportunity cost of this one storage shed is 5 crab puffs, indicated by the change from bundle A to bundle B. However, the last few resources removed kicking and screaming from crab puff production are those BEST suited for crab puffs and LEAST suited for storage sheds. The economy is losing a lot of crab puffs to make one storage shed. At bundle K, the cost of the eleventh storage shed is a whopping 200 dozen crab puffs. What does this mean for the economy? The law of increasing opportunity cost is fundamental to the production and supply of goods. In general, as the economy increases the quantity supplied of a good, the opportunity cost increases. And if cost is higher, then sellers need a higher price, resulting in the law of supply. The Production Possibilities Curve The slope of the production possibilities curve is the opportunity cost of the good measured on the horizontal axis, which in this example is storage sheds. Opportunity cost values for segments between each pair of points is presented on this production possibilities curve. The opportunity cost of producing the first shed, and the slope of the curve moving from point A to point B, is 5 dozen crab puffs (or -5). Production Possibilities Curve Moving along the production possibilities curve, the slope becomes steeper (that is, the absolute value of the slope increases), reaching a value of -200 (an absolute value of 200) between points J and K. This reflects the law of increasing opportunity cost and results in the convex shape for the production possibilities curve. Three alternatives help to illustrate the connection between opportunity cost and the shape of the production possibilities curve. Convex: Increasing Cost (Click the [Convex] button): This is the standard convex production possibilities curve with increasing opportunity cost. Because it best reflects the economy, it is the one most commonly seen throughout the study of economics. In this case the economy foregoes increasing amounts of one good when producing more of the other. Straight: Constant Cost (Click the [Straight Line] button): This is a straight line production possibilities "curve" that indicates constant opportunity cost. In this case, opportunity cost does not change with production. This is not a realistic reflection of the entire economy, but it can represent the production of some goods. Here the economy foregoes the same amount of one good when producing more of the other. Concave: Decreasing Cost (Click the [Concave] button): This is a concave production possibilities curve with decreasing opportunity cost. In this case, opportunity cost actually decreases with greater production. While opportunity cost can decrease in limited circumstances, this is unlikely to happen for the economy as a whole. To do so would contradict the assumption of technical efficiency and it is contrary to real world observations. In this case the economy foregoes decreasing amounts of one good when producing more of the other.


