BIOLOGY KEYSTONE LABS
BIOLOGY KEYSTONE LAB #1 – BASIC BIOLOGICAL PRINCIPLES
STANDARDS:
BIO.A.1.1 Explain the characteristics common to all organisms.
BIO.A.1.1.1 Describe the characteristics of life shared by all prokaryotic and eukaryotic organisms.
ARE SEEDS ALIVE? LAB
BACKGROUND:
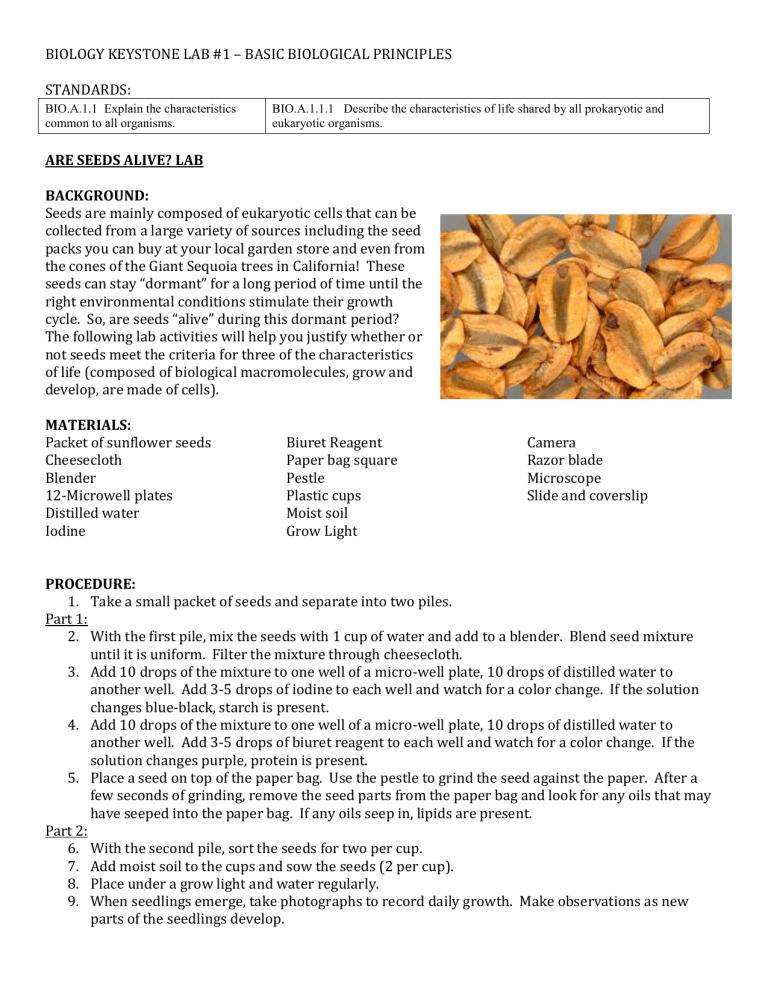
Seeds are mainly composed of eukaryotic cells that can be collected from a large variety of sources including the seed packs you can buy at your local garden store and even from the cones of the Giant Sequoia trees in California! These seeds can stay “dormant” for a long period of time until the right environmental conditions stimulate their growth cycle. So, are seeds “alive” during this dormant period?
The following lab activities will help you justify whether or not seeds meet the criteria for three of the characteristics of life (composed of biological macromolecules, grow and develop, are made of cells).
MATERIALS:
Packet of sunflower seeds
Cheesecloth
Blender
Biuret Reagent
Paper bag square
Pestle
Camera
Razor blade
Microscope
12-Microwell plates
Distilled water
Iodine
Plastic cups
Moist soil
Grow Light
PROCEDURE:
1.
Take a small packet of seeds and separate into two piles.
Part 1:
Slide and coverslip
2.
With the first pile, mix the seeds with 1 cup of water and add to a blender. Blend seed mixture until it is uniform. Filter the mixture through cheesecloth.
3.
Add 10 drops of the mixture to one well of a micro-well plate, 10 drops of distilled water to another well. Add 3-5 drops of iodine to each well and watch for a color change. If the solution changes blue-black, starch is present.
4.
Add 10 drops of the mixture to one well of a micro-well plate, 10 drops of distilled water to another well. Add 3-5 drops of biuret reagent to each well and watch for a color change. If the solution changes purple, protein is present.
5.
Place a seed on top of the paper bag. Use the pestle to grind the seed against the paper. After a few seconds of grinding, remove the seed parts from the paper bag and look for any oils that may
Part 2: have seeped into the paper bag. If any oils seep in, lipids are present.
6.
With the second pile, sort the seeds for two per cup.
7.
Add moist soil to the cups and sow the seeds (2 per cup).
8.
Place under a grow light and water regularly.
9.
When seedlings emerge, take photographs to record daily growth. Make observations as new parts of the seedlings develop.
Part 3:
10.
After Part 2 has proceeded for a period of time, remove a small portion of the plant and thinly slice it with a razor blade.
11.
Prepare a wet-mount slide of the thin plant slice and view under a microscope.
12.
Sketch an image of the thin slice and record magnification.
HYPOTHESIS:
Will there be a difference? Write your hypothesis in the space provided.
Part 1: Water test vs. Seed solution
Iodine (Starch, Carbohydrate test) –
Biuret (Protein test) –
Paper bag (Lipid test) –
Part 2: Sowing seeds vs. not sowing seeds
Part 3: Microscope observations, what should you see?
DATA TABLE:
Part 1 – All living things are composed of biological macromolecules.
Testing Reagent
Water test result
(observations, color)
Iodine (Starch, Carbohydrate)
Seed mixture test result
(observations, color)
Biuret (Protein)
Paper bag (Lipids)
Part 2 – All living things grow and develop.
Record observations throughout the growth of the seedling.
Day ______ Day ______
Part 3 – All living things are composed of cells.
Draw what you saw under the microscope.
Day ______
Magnification __________________________
CONCLUSIONS:
Write your conclusions based on your hypotheses above. Are seeds alive?
Part 1 –
Part 2 –
Part 3 -
POSSIBLE LAB EXTENSIONS:
What are the other characteristics of life that we didn’t test for in this experiment? Could you design a test for one of those to perform on seeds?
BIOLOGY KEYSTONE LAB #2 – CHEMISTRY OF LIFE
STANDARDS:
BIO.A.2.3 Explain how enzymes regulate biochemical reactions within a cell.
BIO.A.2.3.1 Describe the role of an enzyme as a catalyst in regulating a specific biochemical reaction.
BIO.A.2.3.2 Explain how factors such as pH, temperature, and concentration levels can affect enzyme function.
ENZYME SALAD LAB
Have you ever noticed the warning on a JELL-O package not to use fresh or frozen pineapple? In this investigation, you will find out why that warning is there!
BACKGROUND:
The enzymes in some tropical fruits can break down other food molecules. For example, meat tenderizers are manufactured to contain an enzyme, papain, extracted from papayas, which breaks down proteins. We use it to soften up a tough piece of meat. Pineapples, commonly grown in Oahu, Hawaii, contain a digestive enzyme called bromelin. What does bromelin break down?
MATERIALS:
Four test tubes
Fresh pineapple
Hot gelatin (unflavored)
Canned pineapple
Ice water bath
Frozen pineapple
Glass marker
Knife
Test tube rack
PROCEDURE:
1.
Using the knife, carefully cut equal sized pieces of fresh, canned and frozen pineapple that will fit into the test tubes.
2.
Label the test tubes 1, 2, 3 and 4.
3.
Pour 3 mL of hot liquid gelatin into each of the four test tubes.
4.
Place the different pieces of pineapple into the first three test tubes. Fresh, canned and frozen, into 1, 2, 3, respectively.
5.
Leave test tube 4 to only contain gelatin, no pineapple.
6.
Mix the contents of the tubes by rolling them upright between the palms of your hands.
7.
Place all four test tubes into the ice water bath.
8.
Every five minutes, check to see if the gelatin is setting in the tubes. When test tube #4 has gelled firmly, remove all the tubes and compare the results.
9.
Record your observations in the table and write a conclusion. Then answer the questions.
HYPOTHESIS:
Will there be a difference? Write your hypothesis in the space provided.
DATA TABLE:
Tube #
1
Contents
Gelatin and Fresh Pineapple
2
3
Gelatin and Canned Pineapple
Gelatin and Frozen Pineapple
Results
4 Gelatin only
CONCLUSION:
Write your conclusion based on your hypothesis above.
FOLLOW-UP QUESTIONS:
1.
Why did test tube #4 only contain gelatin?
2.
What could account for the different results in the tubes? How is an enzyme a catalyst?
3.
How could the canning process (temperature factor) change the affect of bromelin onto gelatin?
4.
What could you do to fresh pineapple so that when you would place it in the gelatin it will still solidify?
5.
Draw an illustration of the enzyme bromelin’s action onto the gelatin molecule.
POSSIBLE LAB EXTENSIONS:
1. Only using the fresh pineapple, place the pieces in different temperatures before adding to the gelatin to see if temperature has an affect on how well the enzymes work. Graph your results.
2. Only using the fresh pineapple, soak the pieces in solutions of various pH before adding to the gelatin to see if pH has an affect on how well the enzymes work. Graph your results.
BIOLOGY KEYSTONE LAB #3 – HOMEOSTASIS AND TRANSPORT
STANDARDS:
BIO.A.4.1 Identify and describe the cell structures involved in transport of materials into, out of, and throughout a cell.
BIO.A.4.1.1 Describe how the structure of the plasma membrane allows it to function as a regulatory structure and/or protective barrier for a cell.
BIO.A.4.1.2 Compare the mechanisms that transport materials across the plasma membrane (i.e., passive transport—diffusion, osmosis, facilitated diffusion; and active transport—pumps, endocytosis, exocytosis).
OSMOSIS RATES ACROSS THREE CELLS LAB
Can cells maintain homeostasis when conditions are changed? Which cells will respond the fastest?
BACKGROUND:
Living cells have homeostatic mechanisms integrated within their cell and organelle membranes that maintain constant water pressure, ion concentrations and glucose concentrations, for example, within the cell. These internal conditions vary among different types of cells. Some cell types can absorb and release water at faster rates than others. California raisins are made with this concept. The grape clusters are picked and laid to dry in the field on paper. The California sun dries the grapes of their water content. This lab is meant to compare these rates.
MATERIALS:
Specimens
Chicken egg
Small box of raisins
Elodea sprig
25% NaCl
Water
Vinegar
Cup
Centigram balance
Paper towels
Microscope
Microscope slide and coverslip
Timer
PROCEDURE:
Pre-lab:
1.
Place the sprig of Elodea in a beaker of 25% salt water. Complete the initial set-up for the chicken egg and raisins while the Elodea soaks. All three labs can be completed at the same time with careful planning especially if students work in groups of 3 (one student per specimen).
For the chicken egg:
2.
Find the mass of the chicken egg by placing it into an empty cup that has been massed. Find the difference between the masses and record in the data table. Make drawings of the initial observations of it.
3.
Place the chicken egg in a cup with 125 mL of vinegar. Observe the break down of the shell with the vinegar.
4.
Wait 15 minutes and remove the egg from the vinegar without discarding the solution. Rinse the egg and carefully pat it dry with a paper towel. Obtain the mass again and record. Replace the egg back in the vinegar.
5.
Repeat step 4 for as long as time allows. Let the egg remain in the vinegar overnight and make one additional measurement one day later.
For the raisins:
6.
Take the mass of 5-10 raisins. Record in the data table. Make drawings of the initial observations of them.
7.
Place the raisins in a small cup with 25 mL of water.
8.
Wait 15 minutes and remove all of the raisins from the water without discarding the solution. Pat them dry with a paper towel. Obtain their mass again and record. Replace the raisins in the water.
9.
Repeat step 8 for as long as time allows.
For the Elodea leaf:
10.
Prepare a wet mount slide of one Elodea leaf.
11.
Observe the Elodea leaf under the microscope at low power (100x). Make an accurate sketch of the size of the cells with careful notice of the location of the cell membrane (it should look like a central vacuole).
12.
Using capillary action, place a paper towel strip on one side of the coverslip and apply a few drops of plain water to the opposite side drawing the salt water out from the Elodea leaf.
13.
Start a timer as soon as you add the plain water and make observations every 30 seconds.
Estimate the percentage of coverage the cell membrane and its contents make up within the cell.
Record your estimations every 30 seconds until there is no change.
14.
Add plain water in the same manner as step 12 one or two more times to flush out the remaining salt water. Continue to make observations and estimates of percent coverage.
15.
Record your observations in the table and write a conclusion. Then answer the questions.
HYPOTHESIS:
Will there be a difference? Write your hypothesis in the space provided.
OBSERVATIONS AND DATA TABLES:
Time Mass, grams
For the egg:
0 min
15 min
30 min
45 min
1 day
Initial drawing of the egg shape and shell
For the raisins:
Number of raisins used ________________
Initial drawing of the raisin’s shape
For the Elodea:
Initial drawing of the Elodea’s cells
CONCLUSION:
Write your conclusion based on your hypothesis above.
Time
0 min
15 min
30 min
45 min
After 24 hours
Mass, grams
Time
0 sec
30 sec
1 min
1.5 min
2 min
2.5 min
3 min
3.5 min
4 min
4.5 min
5 min
% Coverage
FOLLOW-UP QUESTIONS:
1.
Which type of cell reached its maximum size at the fastest rate?
2.
Why do you think that type of cell was the fastest?
3.
What is osmosis (in your own words)?
4.
Why was salt water used to soak the Elodea in the pre-lab?
POSSIBLE LAB EXTENSIONS:
1.
Compare different types of eggs, grapes or aquatic leaves.
2.
Measure the rate of deflation of the cells instead of inflation of water. Use syrup for the egg, a drying oven for the raisins and salt water for the Elodea.
BIOLOGY KEYSTONE LAB #4 – BIOENERGETICS
STANDARDS:
BIO.A.3.1 Identify and describe the cell structures involved in processing energy.
BIO.A.3.1.1 Describe the fundamental roles of plastids (e.g., chloroplasts) and mitochondria in energy transformations.
PIGMENT CHROMATOGRAPHY LAB
Why are plants green? Why do leaves change different colors in the fall or when they start to die? Are all green plants composed of the same pigment molecules?
BACKGROUND:
The leaves of plants contain a tissue layer through the middle called the mesophyll. This spongy layer is made of plant cells containing the organelle that is the key to photosynthesis: the chloroplast. Embedded within the membrane of the thylakoid inside of the chloroplast, are the pigment molecules responsible for trapping light and converting it into a chemical form.
Different plants synthesize different pigment molecules. These pigments are responsible for absorbing different wavelengths of light. Depending on each plant’s genetics, having a variety of pigments yields different green and other colors found in leaves.
MATERIALS:
Leaves/Branches of leaves (needles) from three different plants:
Evergreen, Deciduous, Tropical (common to Hawaiian Rainforests)
Mortar and Pestle
Water
Thin pipettes or capillary tubes
Chromatography paper cut into strips to fit the length of the test tube
Pencil
Chromatography solvent
Aluminum foil (or plastic wrap and a rubber band)
Large test tubes
Test tube rack
PROCEDURE:
1.
Remove a single leaf or few needles from each branch. Break into small pieces and put them into the mortar. (Process each type of leaf separately cleaning the mortar in between trials)
2.
Add a splash of water to the mortar and grind with the pestle until a dark green liquid is evident.
3.
Using the pencil, draw a horizontal line across the bottom of the chromatography paper strip approximately one-thumb width off the bottom. Mark a small “X” in the middle of the line.
4.
Using the capillary tube, transfer a small amount of green liquid from the mortar to the X on the paper. Allow the green spot to dry before applying more liquid. Repeat the application until the spot is dark but not large (try to keep it small but concentrated).
5.
Pour a small amount of chromatography solvent into the test tube tall enough to barely touch the bottom of the paper if inserted.
6.
Drop the paper down into the test tube and cover with a square of aluminum foil. Allow the test tube to sit uninterrupted until the solvent moves 2/3 of the way up the paper.
7.
Remove the paper from the tube and allow to dry.
8.
Immediately mark the distance the solvent traveled and the maximum distance each pigment traveled up the paper with a pencil mark.
9.
Repeat steps 1-8 with the other two leaf types for comparison.
10.
Record your observations using colored pencils below and write a conclusion. Then answer the questions.
HYPOTHESIS:
Will there be a significant difference? Write your hypothesis in the space provided.
DATA DRAWINGS:
Leaf sample: _________________ Leaf sample: _________________
CONCLUSION:
Write your conclusion based on your hypothesis above.
Leaf sample: _________________
FOLLOW-UP QUESTIONS:
1.
Chlorophyll a and b are both green (dark green and blue green). Were both chlorophyll a and b present in all three leaf types?
2.
What is the leaf’s advantage for having both chlorophyll a and b?
3.
Which leaf type contained the most variety of pigments? The least?
4.
Did you notice a difference in the thickness of the waxy cuticle? What is the purpose of the waxy cuticle? Which leaf was the hardest to grind up?
POSSIBLE LAB EXTENSIONS:
1.
Test different types of coniferous leaves (needles) against each other. Repeat with deciduous or tropical varieties.
2.
Compare different flower petals from different flowers of the same color.
BIOLOGY KEYSTONE LAB #5 – ECOLOGY
STANDARDS:
BIO.B.4.2 Describe interactions and relationships in an ecosystem.
BIO.B.4.2.3 Describe how matter recycles through an ecosystem (i.e., water cycle, carbon cycle, oxygen cycle, and nitrogen cycle).
NUTRIENT CYCLE LAB
How do nutrients cycle in and out of organisms and the environment?
BACKGROUND:
Biogeochemical cycles are used to describe the way matter makes its way through the biosphere, lithosphere, hydrosphere and atmosphere. There is a finite amount of matter on Earth and a continual supply of energy from the sun. This energy is what drives the water, carbon, oxygen and nitrogen cycles of matter. It is difficult to see the cycling of matter as most forms are invisible to the human eye. In this lab, the property of color will be used to reveal the movement of molecules into and out of two organisms: fish and Elodea, an aquatic plant.
MATERIALS:
Bromthymol Blue chemical indicator (yellow in acidic pH, green as neutral and blue in basic pH)
Baby food jars with lids
Permanent marker
Masking tape
Distilled water
Small feeder goldfish (Usually ~ 7/$1.00)
Elodea sprigs
Cardboard box
Plant light
Dilute hydrochloric acid
Dilute sodium hydroxide
PROCEDURE:
1.
Prepare the 0.1% bromthymol blue solution by adding 1 mL of indicator to 1000 mL of distilled water. The final color should be dark enough to determine yellow from green from blue.
2.
Add a few drops of dilute hydrochloric acid or dilute sodium hydroxide so adjust the color of the bromthymol blue water solution to a neutral green.
3.
Label four baby food jars 1-4.
4.
Fill the four baby food jars three-quarters full with the green bromthymol blue water solution.
5.
Add one sprig of Elodea to jar 1, one fish to jar 2, one sprig of Elodea and one fish to jar 3, and nothing to jar 4. Replace the lids and seal completely.
6.
Invert all jars and place under a plant light for 24 hours. (As a comparison experiment, jars can be placed under a cardboard box). Record the final color of the bromthymol solution.
HYPOTHESIS:
Will there be a significant difference? Write your hypothesis in the space provided.
DATA TABLE:
Jar Number
1
2
3
Contents
Elodea
Fish
Elodea + Fish
Final color
4 Neither
CONCLUSION:
Write your conclusion based on your hypothesis above.
FOLLOW-UP QUESTIONS:
1.
Carbon dioxide combines with water to form carbonic acid. Which process is responsible for the formation of CO
2
, which organism produced it, and how can you tell in this investigation?
2.
Are there any other chemicals released by either of these organisms that could change the color of the indicator?
3.
Would the results have been the same if the jars were placed under the cardboard box (or in the plant light)? Explain.
POSSIBLE LAB EXTENSIONS:
1.
Double or triple the Elodea sprigs or fish to see a faster result.
2.
Use the cardboard box or plant light alternative.
3.
Experiment with other aquatic organisms (different plants or snails) to compare the results.
BIOLOGY KEYSTONE LAB #6 – CELL GROWTH AND REPRODUCTION
STANDARDS:
BIO.B.1.1 Describe the three stages of the cell BIO.B.1.1.1 Describe the events that occur during the cell cycle: interphase, nuclear division (i.e., mitosis or meiosis), cytokinesis. cycle: interphase, nuclear division, cytokinesis.
PLANT GROWTH LAB
What is the rate of growth of radish seeds? And, how do organisms “grow”?
BACKGROUND:
One characteristic of life is “all living things grow.” If it is a multicellular organism, growth is indicated by an increase in cell number. In a single-celled organism, growth is indicated by a slight increase in cell size followed by division into two new cells. For bacteria, binary fission is this process. For eukaryotes, mitosis is the process of nuclear division followed by cytokinesis to divide the membrane and cytoplasm.
In this investigation, you will chart the growth of a plant by measuring the combined length of the root and stem over time. You will then observe mitosis under the microscope in another species.
MATERIALS:
Growing spheres, Regular or Jumbo size
(teachersource.com)
Water
Large test tubes *to hold the growing sphere
Rapid-Radish seeds
Plastic wrap
Rubber bands
Centimeter rulers
Prepared slides of Allium sp.
Light microscope
PROCEDURE:
Pre-lab
1.
Hydrate the grow spheres by placing one in a beaker covered by water for at least 24-hours, the longer it sits in water the larger it gets. Grow spheres are used in this lab so students can view small changes in the growth of their seeds.
Growth Lab
2.
Insert a single radish seed into one grow sphere so it is just inside the edge with the pointed tip towards the middle. Carefully add the grow sphere to each test tube so the seed will be able to sprout upward.
3.
Measure the length of the root + stem by viewing through the edge of the test tube. Continue to measure the growth, until it stops increasing, every other day. Graph your results and draw a best fit straight line through your data points. Calculate the slope of the graph as a rate of growth in cm/day.
4.
Maintain your set-up each day of the investigation by adding a few drops of water to your grow sphere.
Mitosis Lab
1.
Obtain all materials for viewing cells undergoing mitosis through the microscope.
2.
View cells on low or high power (100x or 400x) and make sketches of each stage of mitosis, cytokinesis and interphase. Label the cell plate in cytokinesis.
HYPOTHESIS:
Will there be a difference in your measurements each day? Did your seed “grow”? Can cells be viewed in different stages of mitosis? Write your hypothesis in the space provided.
DATA TABLE:
Time
Day 0
Day 2
Day 4
Day 6
Total length of root + stem (cm)
Time
Day 8
Day 10
Day 12
Day 14
Total length of root + stem (cm)
Time
Day 16
Day 18
Day 20
Day 22
Total length of root + stem (cm)
For the Allium sp.:
Cell in Prophase Cell in Metaphase Cell in Anaphase Cell in Telophase
Cell in Cytokinesis Cell in Interphase
(Label the cell plate)
ANALYSIS:
Graph your growth data over time. Write a title for your graph. Label your X-axis Time, days and your Y-axis Growth, cm. Devise your own scale for each axis.
Calculation of slope:
CONCLUSION:
Write your conclusion based on your hypothesis above.
FOLLOW-UP QUESTIONS:
1.
Did your plant grow? How did your plant’s growth rate compare to your classmates?
2.
Which stage of cell division was the easiest to recognize/draw? Which was the hardest?
3.
Explain how another characteristic of life could have been tested for using plant seeds.
POSSIBLE LAB EXTENSIONS:
1.
Compare different types of seeds and their growth rates.
2.
Compare Allium sp. to Whitefish sp. mitosis slides and note the similarities and differences in the appearance of cell division stages.
BIOLOGY KEYSTONE LAB #7 – GENETICS
STANDARDS:
BIO.B.2.1 Compare Mendelian and non-
Mendelian patterns of inheritance.
BIO.B.2.1.1 Describe and/or predict observed patterns of inheritance (i.e., dominant, recessive, co-dominance, incomplete dominance, sex-linked, polygenic, and multiple alleles).
BIO.B.2.2 Explain the process of protein synthesis (i.e., transcription, translation, and protein modification).
BIO.B.2.2.1 Describe how the processes of transcription and translation are similar in all organisms.
BIO.B.2.3 Explain how genetic information is expressed.
BIO.B.2.3.1 Describe how genetic mutations alter the DNA sequence and may or may not affect phenotype (e.g., silent, nonsense, frameshift).
BIO.B.2.4 Apply scientific thinking, processes, tools, and technologies in the study of genetics.
BIO.B.2.4.1 Explain how genetic engineering has impacted the fields of medicine, forensics, and agriculture (e.g., selective breeding, gene splicing, cloning, genetically modified organisms, gene therapy).
GENE EXPRESSION LABS
How does DNA affect an organism’s life? The proper digestion of lactose, differences in blood types and
GMO rainbow papayas all are related by gene expression.
BACKGROUND:
The central dogma of biology is that DNA is used to make a message (RNA) that is read by a ribosome to build a protein, and the presence of this properly formed protein somewhere in an organism’s body constitutes a trait. There are many examples of this concept that can be tested in the lab.
First, lactose intolerance is a human trait found in individuals whom do not properly make the enzyme lactase. This enzyme is released by the pancreas to break down lactose into galactose and glucose, two molecules that can be absorbed by the intestines. A malformed lactase enzyme is due to a mutation in the gene of the individual. Lactose intolerance is a genetic trait that can be passed on generation to generation. In this investigation, you will be determining the effects of lactase on skim milk
(containing lactose) vs. table sugar (containing sucrose), and use a glucose test strip to determine if the enzyme is functional or not.
A second example is blood types. Humans can have one of four different blood types, eight if you include positive or negative blood. Inheritance of blood type is dependent upon three main alleles: A, B and O. Rh-positive individuals inherit at least one positive allele. In this investigation, you will be blood typing four individuals. You will then apply your knowledge of genetics to determine how these individuals are related (who are the parents and who are the children).
The final example is the Rainbow papaya. In 1998, a genetically modified papaya was first cultivated in Hawaii after years of development. The native papaya was dangerously threatened by Ringspot-Virus, a disease that produces spots on the fruit, thus lowering yields. To produce this transgenic papaya, scientists inserted genes coding for the viral capsid proteins, which allowed the papaya to carry out an immune response upon infection of the Ringspot-Virus. The result has been successful to the healthy production of papayas, however, as they are
genetically modified, they are not approved for sale in many countries. Their genes have also been found spreading to other non-GMO papayas, which is hurting the overall sales. GMO Rainbow papayas are at a very low market price, and many farmers have stopped farming papayas.
MATERIALS:
Lactase tablets (Available at drug stores)
15 mL of milk (lactose)
Distilled water
Table sugar (sucrose)
100 mL Graduated Cylinder
10 mL Graduated Cylinder
400 mL Beakers
Test tubes, test tube rack
Hot plate
Glucose test strips (Available at drug stores)
Stirring rod
ABO Blood typing kit (gives positive result for all four blood types)
PROCEDURE:
Lactose Intolerance:
1.
In one beaker, add one lactase tablet to two hundred milliliters of water. Stir until the tablet has dissolved.
2.
In another beaker, add five grams of sucrose to one hundred milliliters of water. Stir until the sugar has dissolved.
3.
Prepare the denatured enzyme solution by placing twenty milliliters of lactase solution into a
Pyrex test tube. Add 200 mL of tap water to a 400-mL beaker. Place the beaker on a hot plate and boil the system for for at least 30 minutes. Let solution cool.
4.
Label the test tubes with the following labels: Milk+Enzyme, Milk+Water, Milk+Denatured
Enzyme, Sucrose+Enzyme, Sucrose+Water.
5.
In the Milk+Enzyme test tube add 2 mL of milk and 1 mL of lactase solution. Wait two minutes and test for glucose with the glucose test strip. Record this data in the table. If there was glucose present mark a “+” in the table. If glucose was absent, mark a “-“ in the table.
6.
In the Milk+Water test tube add 2 mL of milk and 1 mL of water. Wait two minutes and test for glucose, again recording a “+” or a “-“.
7.
In the Milk+Denatured Enzyme test tube add 2 mL of milk and 1 mL of denatured lactase solution.
Wait, test and record.
8.
In the Sucrose+Enzyme test tube add 2 mL of the sucrose solution and 1 mL of lactase solution.
Wait, test and record.
9.
In the Sucrose+Water test tube add 2 mL of the sucrose solution and 1 mL of water. Wait, test and record.
Blood Typing
1.
Obtain four blood samples and three anti-serums.
2.
Add 2 drops of the first blood sample to each of the three wells (A, B and Rh). Add 2 drops of Anti-
A serum to the first well, 2 drops of Anti-B to the second well, and 2 drops of Anti-Rh to the third well.
3.
Stir each well completely with sterile toothpicks. Wait 1 minute for coagulation. Record your results.
4.
Repeat with the three other blood samples. Record the blood types and genotypes for ABO and
Rh.
5.
Using a punnett square, determine which two blood samples are from the parents and which two blood samples are from the two children.
HYPOTHESIS:
Will there be a difference? Write your hypothesis in the space provided.
Lactose intolerance:
Blood typing:
GMO Papaya:
DATA TABLE:
Lactose Intolerance
Blood typing
Test tube
Milk + Enzyme
Milk + Water
Milk + Denatured Enzyme
Sucrose + Enzyme
Sucrose + Water
Glucose
(+ or -)
Blood Sample
Individual A
Check for coagulation
B Rh
Blood Type
Analysis of Blood Typing: (Punnett square)
Genotype
(ABO)
Genotype
(Rh)
CONCLUSION:
Write your conclusion based on your hypothesis or the information provided.
Lactose Intolerance:
Blood Typing:
GMO Papaya:
FOLLOW-UP QUESTIONS:
1.
Which test tube(s) gave a positive result for glucose? Explain why.
2.
Which test tube(s) gave a negative result for glucose? Explain why.
3.
Is it possible for a type AB+ parent and type B- parent to have a type O- child? Use a punnett square to explain your answer.
4.
Draw a diagram of DNA transformation, like what was done for the papaya, from one cell into another cell’s genome. Use colored pencils to show the DNA from both sources.
POSSIBLE LAB EXTENSIONS:
1.
Test lactase on different types of milk (skim, fat free, almond)
2.
Combine two blood typing kits to design a crime scene. Relabel four preselected blood samples as
Crime Scene blood, Suspect #1, Suspect #2 and Suspect #3. Ask your partner to solve your crime.
3.
Make a model of DNA transformation using craft supplies. Label all of the elements of a gene transformation in your model.
BIOLOGY KEYSTONE LAB #8 – EVOLUTION
STANDARDS:
BIO.B.3.1.1 Explain how natural selection can impact allele frequencies of a population.
BIO.B.3.1 Explain the mechanisms of evolution.
BIO.B.3.1.2 Describe the factors that can contribute to the development of new species (e.g., isolating mechanisms, genetic drift, founder effect, migration).
BIO.B.3.1.3 Explain how genetic mutations may result in genotypic and phenotypic variations within a population.
SPECIATION LAB
Formation of a new species can form in several ways. Darwin’s studies of the Galapagos Island revealed remarkable changes over time for a wide variety of species. In this investigation, you will discover different ways in which species have the opportunity to change, or evolve, over time.
BACKGROUND:
The Hawaiian Islands are an isolated environment 2,400 miles from California. The land composing the islands ranges in age from over 70 million years to just a few hours old. This is relatively young compared to the large North American and Asian plates that bare its nearest landforms. Many species have migrated or were carried by different vectors from the mainland to these islands and separated themselves from their native populations. This isolating mechanism of evolution is called geographic isolation. As both environments change in different ways, natural selection becomes a major component to the selection of new traits in the population that benefit the survivors. The result is the formation of new species, with a unique set of traits adapted to its current environment. Bacteria are so small and capable of surviving extreme conditions, that they can be transported to new environments rather easily.
They also reproduce themselves in very little time and therefore can show mutations faster.
MATERIALS:
Antibiotic disks (variety pack)
Sterile petri dishes
Nutrient agar
Distilled water
Inoculating loops
Isopropyl alcohol
Forceps
Ruler
Incubator
Sterile swabs
Autoclaved test tubes
Parafilm
Permanent marker
PROCEDURE:
1.
Bacteria can be found living in all environments. Picture yourself getting onto an airplane to a remote island, like Hawaii. What will you bring along? Your shoes, clothes, wallet, and toiletries will all have bacteria on them that are also taking this airplane trip to Hawaii. Plan to swab three locations from these common bacteria hiding spots.
2.
Obtain a sterile petri dish with nutrient agar. Using a permanent marker, divide the agar side of your plate into three equal regions. Draw on the exterior of the agar side of the plate and label each region for the location you plan to swab.
3.
Obtain a sterile swab for each location. Proceed to gently swab location number one and transfer onto the agar in the appropriate region. Discard the swab and continue to locations two and three repeating the transfers.
4.
Seal your plate with parafilm, incubate your plate for 24 hours at 37 degrees Celsius.
5.
Remove your plate from the incubator and view the bacterial colonies. Record your colony counts in the data section below.
6.
Select one type of colony from any region of the plate to perform the antibiotic resistance check on.
7.
Obtain a second petri dish containing sterile nutrient agar. Label the dish with the location of the bacterial swabbing site.
8.
Obtain a sterile test tube from your teacher and add 1 mL of distilled water. Using an inoculating loop, remove the selected bacterial colony from your first dish and mix with the water in the test tube. Sterilize your loop in the isopropyl alcohol.
9.
Pour the test tube contents onto the second agar surface inside the petri dish, cover and rotate the dish to distribute evenly. Open the cover, and using sterile forceps evenly distribute each type of antibiotic disk to the agar gently tapping them down so they stick. Cover the petri dish, seal with parafilm
10.
Incubate for 24 hours at 37 degrees Celsius and record your results.
HYPOTHESIS:
Will there be a difference? Write your hypothesis in the space provided.
DATA:
First petri dish results
Region with the most colonies: _________________
Second petri dish results
Zones of inhibition
Antibiotic with the smallest: _________________
Antibiotic with the largest: _________________
CONCLUSION:
Write your conclusion based on your hypothesis above.
FOLLOW-UP QUESTIONS:
1.
Why did you select the three locations to swab? How will bacteria from that location spread to an environment on Hawaii?
2.
What is a zone of inhibition? Interpret your lab results.
3.
State one way in which scientists discover a new species.
4.
How does mutation lead to antibiotic resistance?
POSSIBLE LAB EXTENSIONS:
1.
Test all forms of bacterial/microbial colonies that grow with the antibiotics provided.
2.
Use household cleaning products in the experiment as a way to test cleanliness. Should all surfaces be thoroughly cleaned before travel as to avoid unwanted species in new areas?
