Notes inequlalities
advertisement
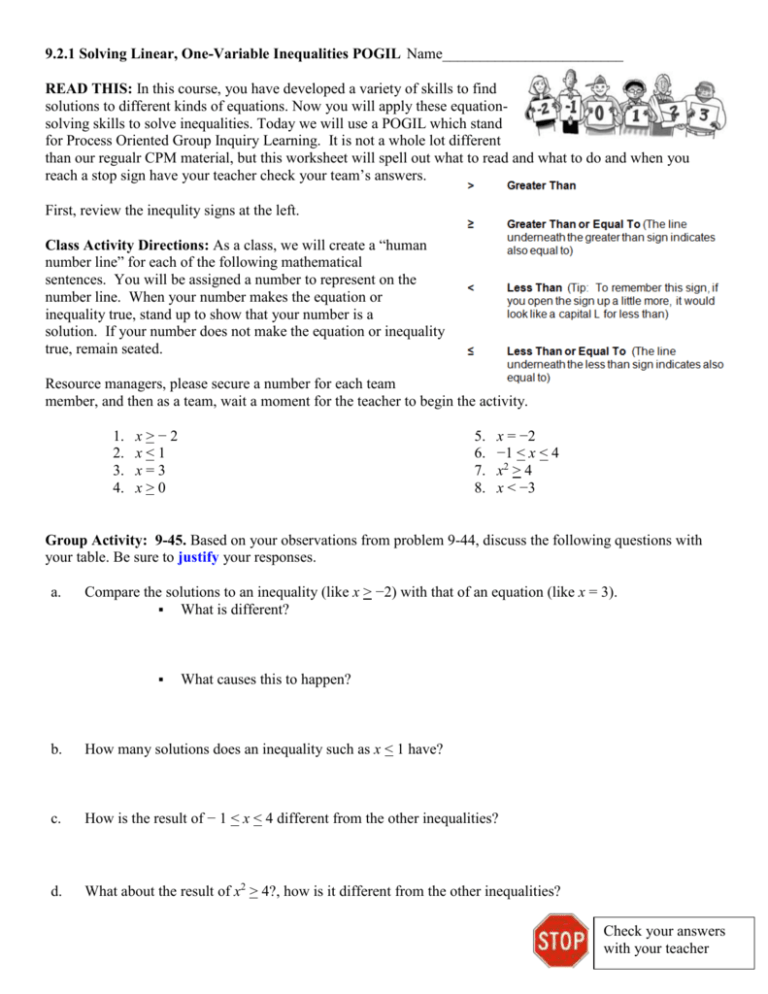
9.2.1 Solving Linear, One-Variable Inequalities POGIL Name________________________ READ THIS: In this course, you have developed a variety of skills to find solutions to different kinds of equations. Now you will apply these equationsolving skills to solve inequalities. Today we will use a POGIL which stand for Process Oriented Group Inquiry Learning. It is not a whole lot different than our regualr CPM material, but this worksheet will spell out what to read and what to do and when you reach a stop sign have your teacher check your team’s answers. First, review the inequlity signs at the left. Class Activity Directions: As a class, we will create a “human number line” for each of the following mathematical sentences. You will be assigned a number to represent on the number line. When your number makes the equation or inequality true, stand up to show that your number is a solution. If your number does not make the equation or inequality true, remain seated. Resource managers, please secure a number for each team member, and then as a team, wait a moment for the teacher to begin the activity. 1. 2. 3. 4. x>−2 x<1 x=3 x>0 5. 6. 7. 8. x = −2 −1 < x < 4 x2 > 4 x < −3 Group Activity: 9-45. Based on your observations from problem 9-44, discuss the following questions with your table. Be sure to justify your responses. a. Compare the solutions to an inequality (like x > −2) with that of an equation (like x = 3). What is different? What causes this to happen? b. How many solutions does an inequality such as x < 1 have? c. How is the result of − 1 < x < 4 different from the other inequalities? d. What about the result of x2 > 4?, how is it different from the other inequalities? Check your answers with your teacher READ THIS: Graphing an inequality on a number line, is very similar to graphing a number. For instance, look at the number line x = 3 shown below. We just put a little dot where the '3' is, right? Now an inequality uses a greater than, less than symbol, and all that we have to do to graph an inequality is find the number, '3' in this case and color in everything above or below it. Just remember if the symbol is (≥ or ≤) then you fill in the dot, like the top two examples in the graph below if the symbol is (> or <) then you do not fill in the dot like the bottom two examples in the graph below To better understand how to graph inequalities, look at the examples below . x<1 x<1 x>0 x>0 a. What do you notice about the graphs? b. How are they similar and how are they different? c. 9-46. Write an inequality that represents the solutions on each number line below. a. c. b. d. Check your answers on the previous page with your teacher READ THIS: Graphing inequalities of equations is very similar to graphing linear equations. Once your linear equation is graphed, you then must focus on the inequality symbol and perform two more steps. In order to succeed with this lesson, you will need to remember how to graph and equation using the slope intercept form y=mx + b . Then there will be two additional steps that you must take when graphing linear inequalities. To the right is a graph for a linear inequality. Notice how we have a boundary line (that can be solid or dotted) and we have a half plane shaded. (Hint: These are the two extra steps that you must take when graphing inequalities.) As shown in this image, the first step will be to determine whether you will use a solid boundary line or a dashed boundary line. The inequality symbol will help you to determine the boundary line. Key point: If the inequality symbol is greater than or less than, then you will use a dotted boundary line. This means that the solutions are NOT included on the boundary line. Key point: If the inequality symbol is greater than or equal to or less than or equal to, then you will use a solid line to indicate that the solutions are included on the boundary line. The second step will be to determine which half plane to shade. 1.Consider the linear equation y=2x + 2. a. What is the slope? b. What is the y intercept? c. Explain how you would use this information to graph the line. 2. Now we will graph y< 2x + 2. a. since we have a less than sign, what type of line will you draw? 3. Draw the line on your graph using the information from part 1 and 2 on the previous page. Now we will determine, which part of the graph to shade. Pick any point on the graph that is not on the line. For instance, chose, (0,0) because that is easy to substitute into our equation. Substitute the point (0,0) into your equation. Remember, a coordinate pair is in the format (x,y) so (0,0) means that x=0 and y=0. 4. Substitute (0.0) into your equation y< 2x + 2 and solve. 5. Did you get a true statement? If yes, then (0,0) and all points on this side of the line are solutions. If no, then all of the points on the other side of the line are solutions. Shade your solution area on the above graph. Stop and check your answers with your teacher. READ THIS: Next we will learn to graph inequalities on our calculator. General Instructions: 1. Work through each step as a table 2. Compare your graphs for each step 3. Help the team member that has trouble, and do not move on until everyone succeeds (Don’t just sit there waiting, actively help by teaching your team member on how to graph the line) 4. Check off once you complete the step and understand how to do it Ready? Have fun! I CAN… _____1. As a review, graph a linear equation such as y 2 x 3 . Sequence: [ Y= ] [ (-) ] [2] [x,T, ,n] [+] Note: you must use the (-) key for a negative number and the [3] [ZOOM] [6] key for the subtraction operation. If your calculator is already in the standard window (zoom 6), you could just enter “graph” after typing in the equation. _____2. Just for practice, press [ Y= ] and you will see the equation you entered above. Now arrow over as far left as you can go and you will notice the \ next to the Y= will be flashing. Press [enter] [enter]. When you press enter twice you will notice that the flashing \ is now showing the top half shaded. Now, press [graph]. Notice the area above the line is shaded. _____3.Now, press [ Y= ] arrow over to the equation and press clear. Then enter the equation again. Arrow over to the far left and press enter 3 times [enter] [enter] [enter].. You will notice that the bottom of the \ is now shaded. Press [graph]. Notice the area below the line is shaded. ____4. By now you should be thinking, “ Well, so what? The calculator is not giving me the answer by telling me which part is shaded. I have to decided by selecting a point and substituting it into the equation and testing for a true or false statement. ( as shown on the previous page.) The good news is that most of you have an app on your calculator that will determine which part should be shaded for you! (TI 84 plus calculators do this. TI 83 will do it but you need to down load the app.) Check the box if you have a TI 84. Leave it blank if you don’t. ____5. Share a calculator if necessary to use the inequality app on a TI 84.. we will graph: [x,T, ,n] Sequence: [ Y= ] [enter] and press [enter] again to continue You should wee your y= equation with a menu of inequalities at the bottom of the screen. [2] [+] [ 1 ] [app] arrow down to Inequalz press Use your [alpha] and the appropriate button below the inequality to select what you want. In this case we want > so we will select the last button. Notice the = sign changed to the inequality selected and it automatically highlighted above the \. Press [graph] ____6. Just because the calculator shaded above the line, let’s use our algebra skills and check by substituting (0,0) into the equation . Show your work here and explain why the calculator was correct. Check your answers with your teacher. 9-47. SOLUTIONS TO A LINEAR INEQUALITY 1. With your study team, find at least five x-values that make the inequality below true: 2x − 5 > 3 a. How many solutions are there? b. What is the smallest solution for x? This point is called a boundary point. c. What is the significance of the boundary point? 2.What is its relationship with the inequality 2x − 5 > 3? a. Rewrite an inequality to solve for x. b. Draw a number line and highlight the solutions for x. 9-48. SOLVING LINEAR INEQUALITIES WITH ONE VARIABLE Analyze the process for solving an inequality, such as 3 − 2x < 1, by addressing the questions below. a. The key point to start with is the boundary point. How can you quickly solve for this point? Once you have determined your strategy, find the boundary point for 3 − 2x < 1. b.Decide if the boundary point is part of the solution to the inequality. If it is part of the solution, indicate this on a number line with a filled circle (point). If it is not a solution, show this by using an open circle as a boundary point. c. Finally, to determine on which side of the boundary the solutions lie, choose a point to test in the inequality. If the point is a solution, then all points on that side of the boundary are part of the solution. If the point is not a solution, what does that tell you about the solutions? Write your solutions to 3 − 2x < 1 as an inequality and represent the solutions on a number line. 9-49. With your study team, find all of the solutions to the inequality 3x + 1 < 7. Decide how to represent these solutions on a number line and be prepared to justify your decisions to the class. Finally, as a team review these notes. Inequality Symbols Just as the symbol “=” is used to represent that two < less than quantities are equal in mathematics, the inequality symbols at right are used when describing the < less than or equal to relationships between quantities that are not necessarily equal. > greater than > greater than or equal to When graphing an inequality on a number line, such as x ≥ −1, a filled circle (point) indicates that the value is a solution of the inequality, as shown at right. An open circle indicates that the value is not part of the solution, as in x < –3, as shown at right. Check your answers with your teacher. HW 9-53 and worksheet

