Identification of the auditory thalamus using multi
advertisement
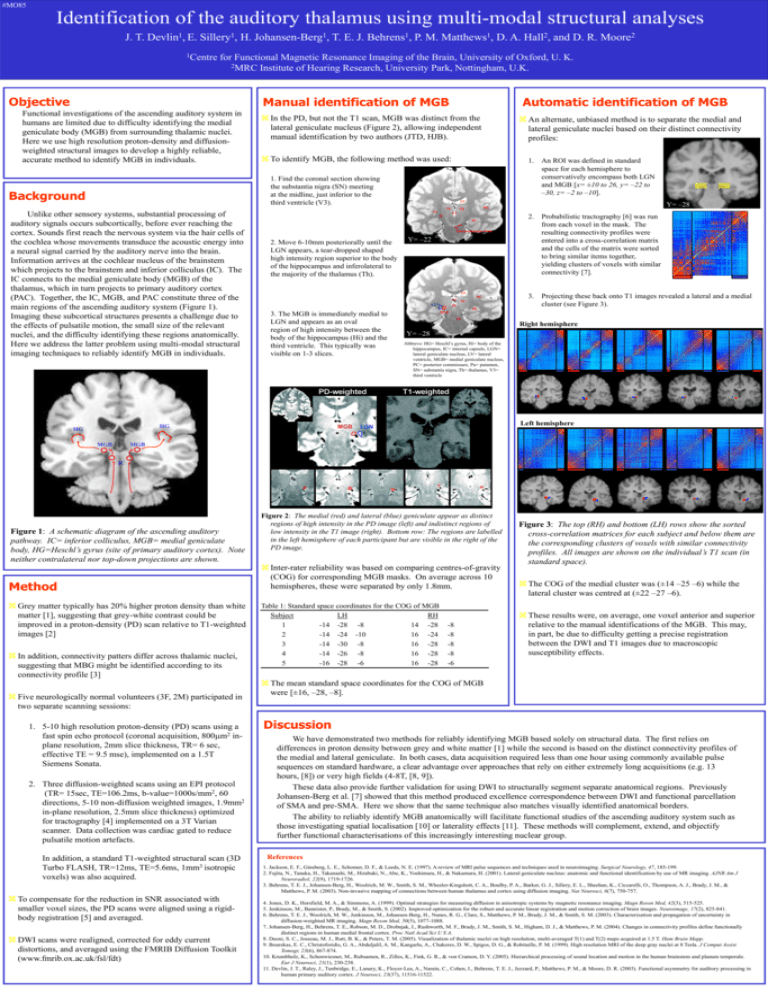
#MO85 Identification of the auditory thalamus using multi-modal structural analyses J. T. Devlin1, E. Sillery1, H. Johansen-Berg1, T. E. J. Behrens1, P. M. Matthews1, D. A. Hall2, and D. R. Moore2 1Centre for Functional Magnetic Resonance Imaging of the Brain, University of Oxford, U. K. 2MRC Institute of Hearing Research, University Park, Nottingham, U.K. Objective Automatic identification of MGB Manual identification of MGB Functional investigations of the ascending auditory system in humans are limited due to difficulty identifying the medial geniculate body (MGB) from surrounding thalamic nuclei. Here we use high resolution proton-density and diffusionweighted structural images to develop a highly reliable, accurate method to identify MGB in individuals. In the PD, but not the T1 scan, MGB was distinct from the lateral geniculate nucleus (Figure 2), allowing independent manual identification by two authors (JTD, HJB). To identify MGB, the following method was used: 1. An ROI was defined in standard space for each hemisphere to conservatively encompass both LGN and MGB [x= ±10 to 26, y= –22 to –30, z= –2 to –10]. 1. Find the coronal section showing the substantia nigra (SN) meeting at the midline, just inferior to the third ventricle (V3). Background LV Th Unlike other sensory systems, substantial processing of auditory signals occurs subcortically, before ever reaching the cortex. Sounds first reach the nervous system via the hair cells of the cochlea whose movements transduce the acoustic energy into a neural signal carried by the auditory nerve into the brain. Information arrives at the cochlear nucleus of the brainstem which projects to the brainstem and inferior colliculus (IC). The IC connects to the medial geniculate body (MGB) of the thalamus, which in turn projects to primary auditory cortex (PAC). Together, the IC, MGB, and PAC constitute three of the main regions of the ascending auditory system (Figure 1). Imaging these subcortical structures presents a challenge due to the effects of pulsatile motion, the small size of the relevant nuclei, and the difficulty identifying these regions anatomically. Here we address the latter problem using multi-modal structural imaging techniques to reliably identify MGB in individuals. An alternate, unbiased method is to separate the medial and lateral geniculate nuclei based on their distinct connectivity profiles: Pu V3 IC Hi SN Interpeduncular fossa 2. Move 6-10mm posteriorally until the LGN appears, a tear-dropped shaped high intensity region superior to the body of the hippocampus and inferolateral to the majority of the thalamus (Th). Y= –22 LV HG V3 Th PC LGN MGB 2. Probabilistic tractography [6] was run from each voxel in the mask. The resulting connectivity profiles were entered into a cross-correlation matrix and the cells of the matrix were sorted to bring similar items together, yielding clusters of voxels with similar connectivity [7]. 3. Projecting these back onto T1 images revealed a lateral and a medial cluster (see Figure 3). Hi 3. The MGB is immediately medial to LGN and appears as an oval region of high intensity between the body of the hippocampus (Hi) and the third ventricle. This typically was visible on 1-3 slices. MGB SN Right hemisphere Y= –28 Abbrevs: HG= Heschl’s gyrus, Hi= body of the hippocampus, IC= internal capsule, LGN= lateral geniculate nucleus, LV= lateral ventricle, MGB= medial geniculate nucleus, PC= posterior commissure, Pu= putamen, SN= substantia nigra, Th= thalamus, V3= third ventricle Left hemisphere HG HG Y= –28 HG Th MGB IC Figure 1: A schematic diagram of the ascending auditory pathway. IC= inferior colliculus, MGB= medial geniculate body, HG=Heschl’s gyrus (site of primary auditory cortex). Note neither contralateral nor top-down projections are shown. Method Grey matter typically has 20% higher proton density than white matter [1], suggesting that grey-white contrast could be improved in a proton-density (PD) scan relative to T1-weighted images [2] In addition, connectivity patters differ across thalamic nuclei, suggesting that MBG might be identified according to its connectivity profile [3] Five neurologically normal volunteers (3F, 2M) participated in two separate scanning sessions: 1. 5-10 high resolution proton-density (PD) scans using a fast spin echo protocol (coronal acquisition, 800m2 inplane resolution, 2mm slice thickness, TR= 6 sec, effective TE = 9.5 mse), implemented on a 1.5T Siemens Sonata. 2. Three diffusion-weighted scans using an EPI protocol (TR= 15sec, TE=106.2ms, b-value=1000s/mm2, 60 directions, 5-10 non-diffusion weighted images, 1.9mm2 in-plane resolution, 2.5mm slice thickness) optimized for tractography [4] implemented on a 3T Varian scanner. Data collection was cardiac gated to reduce pulsatile motion artefacts. In addition, a standard T1-weighted structural scan (3D Turbo FLASH, TR=12ms, TE=5.6ms, 1mm3 isotropic voxels) was also acquired. To compensate for the reduction in SNR associated with smaller voxel sizes, the PD scans were aligned using a rigidbody registration [5] and averaged. DWI scans were realigned, corrected for eddy current distortions, and averaged using the FMRIB Diffusion Toolkit (www.fmrib.ox.ac.uk/fsl/fdt) Figure 2: The medial (red) and lateral (blue) geniculate appear as distinct regions of high intensity in the PD image (left) and indistinct regions of low intensity in the T1 image (right). Bottom row: The regions are labelled in the left hemisphere of each participant but are visible in the right of the PD image. Inter-rater reliability was based on comparing centres-of-gravity (COG) for corresponding MGB masks. On average across 10 hemispheres, these were separated by only 1.8mm. Table 1: Standard space coordinates for the COG of MGB Subject LH RH 1 -14 -28 -8 14 -28 2 -14 -24 -10 16 -24 3 -14 -30 -8 16 -28 4 -14 -26 -8 16 -28 5 -16 -28 -6 16 -28 -8 -8 -8 -8 -6 Figure 3: The top (RH) and bottom (LH) rows show the sorted cross-correlation matrices for each subject and below them are the corresponding clusters of voxels with similar connectivity profiles. All images are shown on the individual’s T1 scan (in standard space). The COG of the medial cluster was (±14 –25 –6) while the lateral cluster was centred at (±22 –27 –6). These results were, on average, one voxel anterior and superior relative to the manual identifications of the MGB. This may, in part, be due to difficulty getting a precise registration between the DWI and T1 images due to macroscopic susceptibility effects. The mean standard space coordinates for the COG of MGB were [±16, –28, –8]. Discussion We have demonstrated two methods for reliably identifying MGB based solely on structural data. The first relies on differences in proton density between grey and white matter [1] while the second is based on the distinct connectivity profiles of the medial and lateral geniculate. In both cases, data acquisition required less than one hour using commonly available pulse sequences on standard hardware, a clear advantage over approaches that rely on either extremely long acquisitions (e.g. 13 hours, [8]) or very high fields (4-8T, [8, 9]). These data also provide further validation for using DWI to structurally segment separate anatomical regions. Previously Johansen-Berg et al. [7] showed that this method produced excellence correspondence between DWI and functional parcellation of SMA and pre-SMA. Here we show that the same technique also matches visually identified anatomical borders. The ability to reliably identify MGB anatomically will facilitate functional studies of the ascending auditory system such as those investigating spatial localisation [10] or laterality effects [11]. These methods will complement, extend, and objectify further functional characterisations of this increasingly interesting nuclear group. References 1. Jackson, E. F., Ginsberg, L. E., Schomer, D. F., & Leeds, N. E. (1997). A review of MRI pulse sequences and techniques used in neuroimaging. Surgical Neurology, 47, 185-199. 2. Fujita, N., Tanaka, H., Takanashi, M., Hirabuki, N., Abe, K., Yoshimura, H., & Nakamura, H. (2001). Lateral geniculate nucleus: anatomic and functional identification by use of MR imaging. AJNR Am J Neuroradiol, 22(9), 1719-1726. 3. Behrens, T. E. J., Johansen-Berg, H., Woolrich, M. W., Smith, S. M., Wheeler-Kingshott, C. A., Boulby, P. A., Barker, G. J., Sillery, E. L., Sheehan, K., Ciccarelli, O., Thompson, A. J., Brady, J. M., & Matthews, P. M. (2003). Non-invasive mapping of connections between human thalamus and cortex using diffusion imaging. Nat Neurosci, 6(7), 750-757. 4. Jones, D. K., Horsfield, M. A., & Simmons, A. (1999). Optimal strategies for measuring diffusion in anisotropic systems by magnetic resonance imaging. Magn Reson Med, 42(3), 515-525. 5. Jenkinson, M., Bannister, P., Brady, M., & Smith, S. (2002). Improved optimization for the robust and accurate linear registration and motion correction of brain images. Neuroimage, 17(2), 825-841. 6. Behrens, T. E. J., Woolrich, M. W., Jenkinson, M., Johansen-Berg, H., Nunes, R. G., Clare, S., Matthews, P. M., Brady, J. M., & Smith, S. M. (2003). Characterization and propagation of uncertainty in diffusion-weighted MR imaging. Magn Reson Med, 50(5), 1077-1088. 7. Johansen-Berg, H., Behrens, T. E., Robson, M. D., Drobnjak, I., Rushworth, M. F., Brady, J. M., Smith, S. M., Higham, D. J., & Matthews, P. M. (2004). Changes in connectivity profiles define functionally distinct regions in human medial frontal cortex. Proc Natl Acad Sci U S A. 8. Deoni, S. C., Josseau, M. J., Rutt, B. K., & Peters, T. M. (2005). Visualization of thalamic nuclei on high resolution, multi-averaged T(1) and T(2) maps acquired at 1.5 T. Hum Brain Mapp. 9. Bourekas, E. C., Christoforidis, G. A., Abduljalil, A. M., Kangarlu, A., Chakeres, D. W., Spigos, D. G., & Robitaille, P. M. (1999). High resolution MRI of the deep gray nuclei at 8 Tesla. J Comput Assist Tomogr, 23(6), 867-874. 10. Krumbholz, K., Schonwiesner, M., Rubsamen, R., Zilles, K., Fink, G. R., & von Cramon, D. Y. (2005). Hierarchical processing of sound location and motion in the human brainstem and planum temporale. Eur J Neurosci, 21(1), 230-238. 11. Devlin, J. T., Raley, J., Tunbridge, E., Lanary, K., Floyer-Lea, A., Narain, C., Cohen, I., Behrens, T. E. J., Jezzard, P., Matthews, P. M., & Moore, D. R. (2003). Functional asymmetry for auditory processing in human primary auditory cortex. J Neurosci, 23(37), 11516-11522.
