Math iCLip script with questions (1)
advertisement
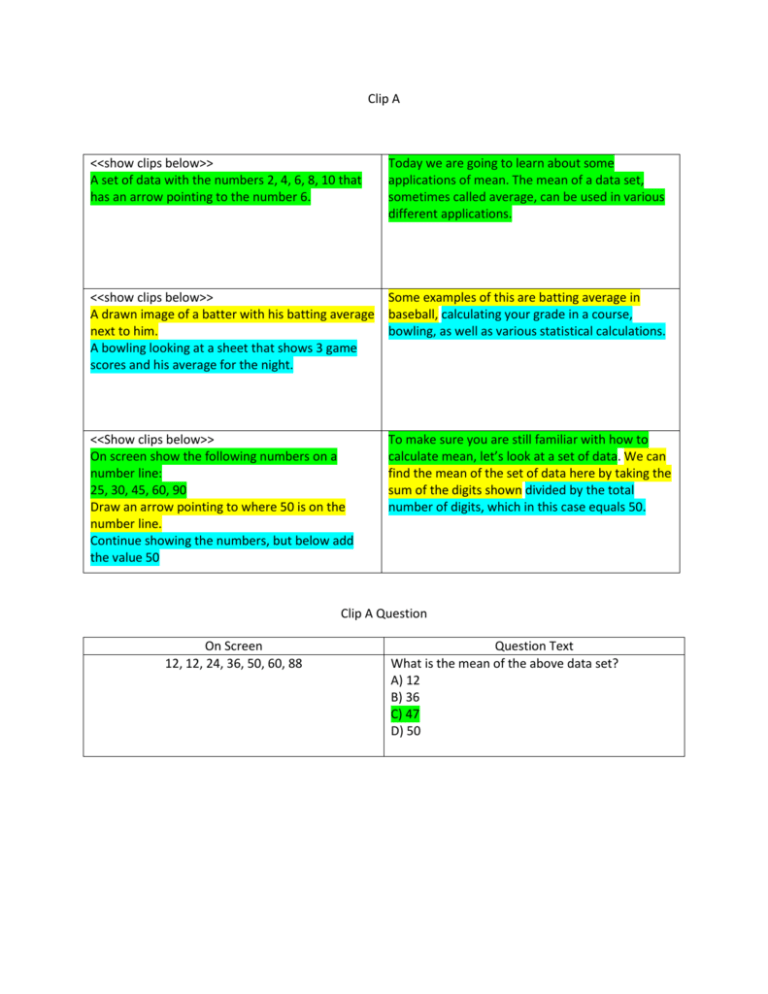
Clip A <<show clips below>> A set of data with the numbers 2, 4, 6, 8, 10 that has an arrow pointing to the number 6. Today we are going to learn about some applications of mean. The mean of a data set, sometimes called average, can be used in various different applications. <<show clips below>> Some examples of this are batting average in A drawn image of a batter with his batting average baseball, calculating your grade in a course, next to him. bowling, as well as various statistical calculations. A bowling looking at a sheet that shows 3 game scores and his average for the night. <<Show clips below>> On screen show the following numbers on a number line: 25, 30, 45, 60, 90 Draw an arrow pointing to where 50 is on the number line. Continue showing the numbers, but below add the value 50 To make sure you are still familiar with how to calculate mean, let’s look at a set of data. We can find the mean of the set of data here by taking the sum of the digits shown divided by the total number of digits, which in this case equals 50. Clip A Question On Screen 12, 12, 24, 36, 50, 60, 88 Question Text What is the mean of the above data set? A) 12 B) 36 C) 47 D) 50 Clip B <<Show clips below>> A clip of a family packing clothes into suitcases. Great job! Now let’s look at a real life application of using mean to find the average temperature for a week. The news will always give you an update on weather. They like to give a forecast so that people expect what the temperature will be. This kind of data is useful if you are going on vacation. You will know what kind of weather to expect and what type of clothes to bring. This clip shows 2 different values, the high temperature and the low temperature. Even though this is different than just a normal set of numbers, the mean is calculated the same way. Clip B Question On Screen <<An image like the one below but showing 7 thermometers with the numbers 66, 68, 64, 70, 76, 74, 72>> Question Text What is the mean temperature for next week with the temperature shown above? A) 67 degrees B) 68 degrees C) 69 degrees D) 70 degrees Clip C <<Show clips below>> Show the numbers 10, 20, 20, 30, 70 on a number line. Point to the number 20 and above the arrow display “Median” Point to the number 50 and above the arrow display “Mean” Let’s take a look again at some difference between measures of center. The mean calculates the average of the values whereas the median calculates the middle number of a data set. <<Show clips below>> Aerial view of a city showing 2 areas, one with extremely nice houses that has fewer houses than another area with normal houses. Draw an arrow to each area, labeled as expensive and inexpensive These are both measures of center, but their applications can differ immensely. When looking to buy a home in a town, you can look at average home value to help you determine what area you should look at. This image shows a small area of expensive houses and a large area of inexpensive houses. Aerial view of a city showing 2 areas, one with extremely nice houses that has fewer houses than another area with normal houses – This time show the expensive area with $$$ and the inexpensive with $ on top of each area. If we took the average of the homes, the value might seem large, but if you took the mean of each area separately, you would get a value more appropriate to the home you were looking to buy. Clip C Question On Screen Show 4 images of homes with the following prices below each one. $90,000 $95,000 $87,000 $80,000 Question Text What is the mean value of the 4 homes shown above? A) $87,000 B) $87,500 C) $88,000 D) $90,000 Clip D <<show clips below>> 12 35 44 ____ 56 Another way to use mean is the real world is when you need to find a missing value. In cases where you have a missing value and know the mean, you can use trial and error or equations to help you find the answer. <<show clips below>> Student looking at multiple tests with grades on 3 of them, then a 4th with a question mark on it Being able to work backward like this can be applied to different scenarios. If you need to get a certain grade in a class, and you know what you go for the first 3 quarters, you can then determine what you need to get in quarter for so that your average for the class is what you intended. Clip D Question On Screen Show a batter on screen and to the right of him a column with the following: Year 1 .302 Year 2 .299 Year 3 .288 Year 4 .290 Year 5 ? Question Text Being what is known as a “300” hitter in baseball is a very hard feat to achieve. You can see 4 out of 5 years of a batters average on the screen. What average does he need in year 5 to have a mean batting average of .300? A) .299 B) .300 C) .320 D) .321 Clip E <<show clips below>> Show a fraction with the following: 30 + 40 + 50 + 60 + 70 =? 5 Replace the “?” with the number 50 When trying to find the missing value in a problem with mean you are working backward from where you normally would. You are usually given the value of each element, which also gives you the total number of elements. So you are missing 1 thing, the mean. <<show clips below>> 30 + 40 + ? + 60 + 70 = 50 5 Replace the “?” with the number 50 When you have a missing value you are still given 2 out of the 3 pieces of information necessary to solve the problem. You know the number of elements and the mean, so you just need to determine the missing value with trial and error or with an equation. <<show clips below>> 1 + 3 + 5+ ? +10 =5 5 5 × 5 = 25 25 – 1 – 3 – 5 – 10 = In this example on screen you know the number of elements and the mean, so you need to find the missing value. One way to do this is to multiply your number of elements, 5, by the mean, which is also 5 in this problem… giving you 25. Now subtract the values you know to find the missing element. Clip E Question On Screen <<Display the following numbers across the screen>> 8 15 ___ 16 18 22 Question Text What is the missing element in the problem on screen to have a mean value of 16? A) 15 B) 17 C) 19 D) 20 Clip F <<Show clips below>> Mean Median Mode Range Being able to differentiate between the different types of statistical measurements is extremely important so that you can effectively apply that information. Each of these values has an important use, but they must be used properly. <<Show clips below>> Show a data set that has an outlier to the far right. Draw an arrow to the outlier. Knowing how to apply the difference between mean and median is useful for different measures of center. Median is useful when there are outliers in your data, but in most other cases the mean would be most beneficial. <<Show clips below>> Show a set of houses on a street with values between 800 and 1,000 kWh on each. Mean can be used in a variety of ways, such as determining your average grade in a course or determining how much electricity most households in an area use each month. Clip F Question On Screen A) The middle number in a set of data. B) The number that is repeated the most in a set of data. C) The total number of elements in a data set divided by the total of the elements. D) The sum of that data divided by the number of elements in the set. Question Text What is the definition of mean? <<On screen show A B C D>> D being correct. Clip G <<Show clips on screen>> Show an image like the one below, but just 3 games for 1 person. Another application of mean is in bowling. In bowling you have 10 rounds in each game, and you usually play 3 games each night. The most points you can get in a game is 300. You can use mean to determine their average score for the night. <<Show clips below>> Show another bowling score image with the following 3 game scores: 255 270 295 Look at the game scores for Peter on his score sheet. He got a 255, 270, and 295. What would his mean score be for the night? What would he have bowled in game 1 to have a mean score of 280 for the night? <<show clips on screen>> 255 + 270 + 295 3 Fade out the 255 and replace with equation below: ? + 270 + 295 = 280 3 His mean for the first 3 games can be found by taking the sum of the games divided by the number of games played, just like finding mean for any data set. To find out how he could have got a 280 for the night, you need to work backward to find the missing element. Clip G Question On Screen Game 1 – 175 Game 2 – 200 Game 3 – 180 Game 4 – 185 Game 5 – 199 Game 6 – 225 Game 7 – 280 Game 8 –290 Game 9 - 300 Question Text John bowled 9 games tonight. What was his mean score for the first 6 games? A) 190 B) 194 C) 220 D) 226


