School Accountability Report Card - Alhambra Unified School District
advertisement
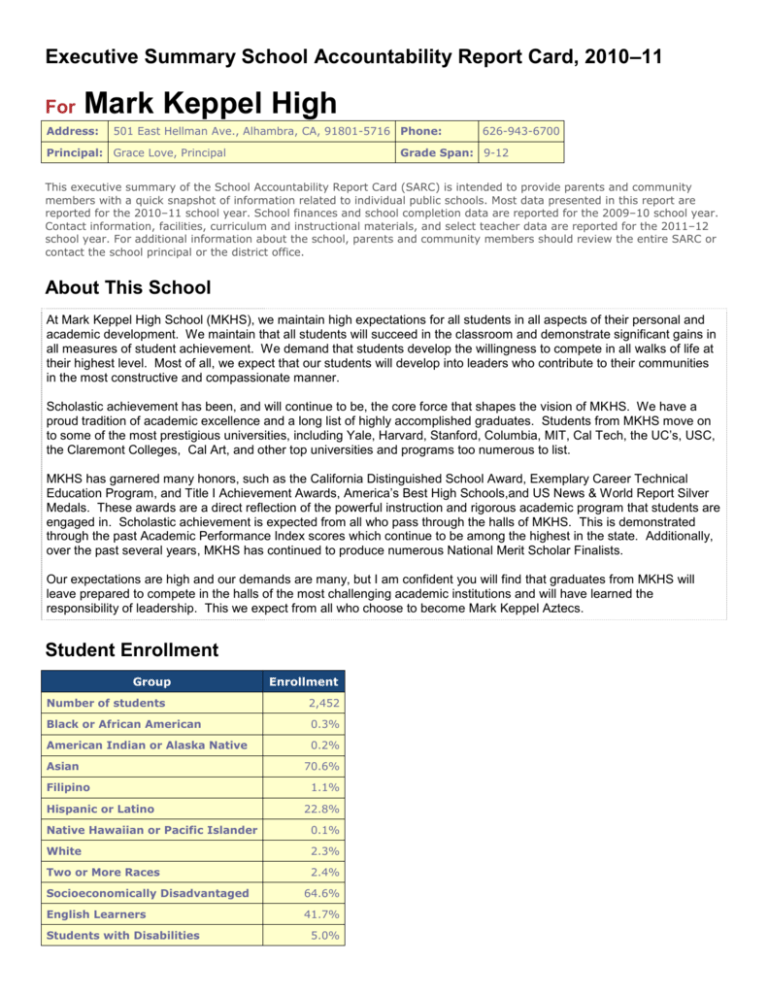
Executive Summary School Accountability Report Card, 2010–11 For Mark Keppel High Address: 501 East Hellman Ave., Alhambra, CA, 91801-5716 Phone: Principal: Grace Love, Principal 626-943-6700 Grade Span: 9-12 This executive summary of the School Accountability Report Card (SARC) is intended to provide parents and community members with a quick snapshot of information related to individual public schools. Most data presented in this report are reported for the 2010–11 school year. School finances and school completion data are reported for the 2009–10 school year. Contact information, facilities, curriculum and instructional materials, and select teacher data are reported for the 2011–12 school year. For additional information about the school, parents and community members should review the entire SARC or contact the school principal or the district office. About This School At Mark Keppel High School (MKHS), we maintain high expectations for all students in all aspects of their personal and academic development. We maintain that all students will succeed in the classroom and demonstrate significant gains in all measures of student achievement. We demand that students develop the willingness to compete in all walks of life at their highest level. Most of all, we expect that our students will develop into leaders who contribute to their communities in the most constructive and compassionate manner. Scholastic achievement has been, and will continue to be, the core force that shapes the vision of MKHS. We have a proud tradition of academic excellence and a long list of highly accomplished graduates. Students from MKHS move on to some of the most prestigious universities, including Yale, Harvard, Stanford, Columbia, MIT, Cal Tech, the UC’s, USC, the Claremont Colleges, Cal Art, and other top universities and programs too numerous to list. MKHS has garnered many honors, such as the California Distinguished School Award, Exemplary Career Technical Education Program, and Title I Achievement Awards, America’s Best High Schools,and US News & World Report Silver Medals. These awards are a direct reflection of the powerful instruction and rigorous academic program that students are engaged in. Scholastic achievement is expected from all who pass through the halls of MKHS. This is demonstrated through the past Academic Performance Index scores which continue to be among the highest in the state. Additionally, over the past several years, MKHS has continued to produce numerous National Merit Scholar Finalists. Our expectations are high and our demands are many, but I am confident you will find that graduates from MKHS will leave prepared to compete in the halls of the most challenging academic institutions and will have learned the responsibility of leadership. This we expect from all who choose to become Mark Keppel Aztecs. Student Enrollment Group Enrollment Number of students 2,452 Black or African American 0.3% American Indian or Alaska Native 0.2% Asian Filipino Hispanic or Latino 70.6% 1.1% 22.8% Native Hawaiian or Pacific Islander 0.1% White 2.3% Two or More Races 2.4% Socioeconomically Disadvantaged 64.6% English Learners 41.7% Students with Disabilities 5.0% Teachers Indicator Teachers Teachers with full credential 84 Teachers without full credential 0 Teachers Teaching Outside Subject Area of Competence 2 Misassignments of Teachers of English Learners 0 Total Teacher Misassignments 2 Student Performance Subject Students Proficient and Above on STAR* Program Results English-Language Arts 63% Mathematics 67% Science 64% History-Social Science 60% *Standardized Testing and Reporting Program assessments used for accountability purposes include the California Standards Tests, the California Modified Assessment, and the California Alternate Performance Assessment. Academic Progress* Indicator Result 2011 Growth API Score (from 2011 Growth API Report) 850 Statewide Rank (from 2010 Base API Report) Met All 2011 AYP Requirements 9 Yes Number of AYP Criteria Met Out of the Total Number of Criteria Possible Met 22 of 22 2011–12 Program Improvement Status (PI Year) Year 1 *The Academic Performance Index is required under state law. Adequate Yearly Progress is required by federal law. School Facilities Summary of Most Recent Site Inspection The most recent inspections by the Mark Keppel HS Plant Foreman found the site to be clean, safe, and in good repair with no major defects requiring emergency repairs. Repairs Needed Most repairs reported on the inspection are general maintenance or wear and tear items. Corrective Actions Taken or Planned Repairs will be scheduled as ongoing routine maintenance. Curriculum and Instructional Materials Core Curriculum Area Pupils Who Lack Textbooks and Instructional Materials Reading/Language Arts 0% Mathematics 0% Science 0% History-Social Science 0% Foreign Language 0% Health 0% Visual and Performing Arts 0% Science Laboratory Equipment (grades 9-12) 0% School Finances Level Expenditures Per Pupil (Unrestricted Sources Only) School Site $5,283 District $5,259 State $5,455 School Completion Indicator Graduation Rate (if applicable) Result 98.05 Postsecondary Preparation Measure Percent Pupils Who Completed a Career Technical Education Program and Earned a High School Diploma 28.98% Graduates Who Completed All Courses Required for University of California or California State University Admission 45.4% School Accountability Report Card Reported Using Data from the 2010–11 School Year Published During 2011–12 Every school in California is required by state law to publish a School Accountability Report Card (SARC), by February 1 of each year. The SARC contains information about the condition and performance of each California public school. For more information about SARC requirements, see the California Department of Education (CDE) SARC Web page at http://www.cde.ca.gov/ta/ac/sa/. For additional information about the school, parents and community members should contact the school principal or the district office. I. Data and Access Ed-Data Partnership Web Site Ed-Data is a partnership of the CDE, EdSource, and the Fiscal Crisis and Management Assistance Team (FCMAT) that provides extensive financial, demographic, and performance information about California’s public kindergarten through grade twelve school districts and schools. DataQuest DataQuest is an online data tool located on the CDE DataQuest Web page at http://dq.cde.ca.gov/dataquest/ that contains additional information about this school and comparisons of the school to the district, the county, and the state. Specifically, DataQuest is a dynamic system that provides reports for accountability (e.g., state Academic Performance Index [API], federal Adequate Yearly Progress [AYP]), test data, enrollment, high school graduates, dropouts, course enrollments, staffing, and data regarding English learners. Internet Access Internet access is available at public libraries and other locations that are publicly accessible (e.g., the California State Library). Access to the Internet at libraries and public locations is generally provided on a first-come, first-served basis. Other use restrictions may include the hours of operation, the length of time that a workstation may be used (depending on availability), the types of software programs available on a workstation, and the ability to print documents. II. About This School Contact Information (School Year 2011–12) School District School Name Mark Keppel High District Name Alhambra Unified Street 501 East Hellman Ave. Phone Number (626) 943-3000 City, State, Zip Alhambra, CA, 91801-5716 Web Site www.ausd.us Phone Number 626-943-6700 Superintendent Donna Perez Principal E-mail Address Grace Love, Principal E-mail Address Love_Grace@alhambra.k12.ca.us CDS Code perez_donna@alhambra.k12.ca.us 19757131934553 School Description and Mission Statement (School Year 2010–11) The Mark Keppel learning community is committed to helping students graduate as self-confident, ethical, resourceful life-long learners in a global society who communicate effectively, think critically and solve problems, work independently and interdependently within the school community, use available technology as a tool, and demonstrate responsible citizenship. Opportunities for Parental Involvement (School Year 2010–11) Parents participate on various committees that make decisions regarding the priorities and direction of the educational plan to ensure instructional programs are consistent with students’ needs and comply with the District’s goals. These committees include: Parent Teacher Student Association (PTSA), Keppel Alliance, English Language Advisory Council (ELAC), School Advisory Council (SAC), and School Site Council (SSC). Parents are also encouraged to volunteer on campus and participate in school-wide events. The school keeps parents informed of activities through newsletters, email, and telephone calls delivered in the families’ home language. The Alhambra Unified School District sponsors the Kindergarten through College project that is designed to educate parents about the importance of preparing for college, starting with students in Kindergarten. The program a few nights of parent training that include topics such as introduction to the college system, applying to college, financial aid, and saving for college. Student Enrollment by Grade Level (School Year 2010–11) Grade Level Number of Students Grade Level Number of Students Kindergarten 0 Grade 8 0 Grade 1 0 Ungraded Elementary 0 Grade 2 0 Grade 9 621 Grade 3 0 Grade 10 645 Grade 4 0 Grade 11 599 Grade 5 0 Grade 12 587 Grade 6 0 Ungraded Secondary Grade 7 0 Total Enrollment 0 2,452 Student Enrollment by Subgroup (School Year 2010–11) Group Percent of Total Enrollment Black or African American 0.3% American Indian or Alaska Native 0.2% Asian Filipino Hispanic or Latino 70.6% 1.1% 22.8% Native Hawaiian or Pacific Islander 0.1% White 2.3% Two or More Races 2.4% Socioeconomically Disadvantaged 64.6% English Learners 41.7% Students with Disabilities 5.0% Average Class Size and Class Size Distribution (Secondary) Subject Avg. Class Size 2008–09 Number of Classes* 1-22 23-32 33+ Avg. Class Size 2009–10 Number of Classes* 1-22 23-32 33+ Avg. Class Size 2010–11 Number of Classes* 1-22 23-32 33+ English 32.5 2 8 22 36.94 22 17 50 30.1 18 24 53 Mathematics 34.0 0 8 21 36.94 23 24 42 33.1 4 6 53 Science 32.3 0 6 8 24.08 9 16 33 33.4 2 7 41 Social Science 32.9 0 6 15 25.74 17 19 26 33.2 4 4 36 * Number of classes indicates how many classrooms fall into each size category (a range of total students per classroom). At the secondary school level, this information is reported by subject area rather than grade level. III. School Climate School Safety Plan (School Year 2010–11) The Safety of students and staff is a primary concern. The school complies with laws, rules, and regulations pertaining to hazardous materials and State earthquake standards. The school’s disaster drills are conducted regularly throughout the school year. All visitors must check in at the school office and wear visitors’ badges while on school grounds. During lunch, recesses, and before and after school, yard supervisors monitor students and school grounds, including the cafeteria and playgrounds, to ensure a safe and orderly environment. The Comprehensive School Safety Plan was developed by the School Site Council in cooperation with local law enforcement in order to comply with Senate Bill 187 of 1997. The plan provides students and staff a means to ensure a safe and orderly learning environment. Components of the Comprehensive School Safety Plan include child abuse reporting procedures, teacher notification of dangerous pupils procedures, disaster response procedures, procedures for safe ingress and egress from school, sexual harassment policy, and suspension and expulsion policies. The School Site Council evaluates the plan annually and updates the plan as needed. The plan was last updated and reviewed with school staff in March 2010. An updated copy is available to the public at the school and district offices. Suspensions and Expulsions Rate* School 2008–09 School 2009–10 School 2010–11 District 2008–09 District 2009–10 District 2010–11 Suspensions 8.08% 5.23% 2.57% 8.42% 6.31% 2.35% Expulsions 1.50% 1.33% 0.53% 1.55% 1.43% 0.30% * The rate of suspensions and expulsions is calculated by dividing the total number of incidents by the total enrollment. IV. School Facilities School Facility Conditions and Planned Improvements (School Year 2011–12) Renovations and improvements are being planned for several locations on the campus by the District’s Construction & Facilities team. Details will be available as the school year progresses. School Facility Good Repair Status (School Year 2011–12) System Inspected Repair Status Exemplary Good Fair Systems: Gas Leaks, Mechanical/HVAC, Sewer X Interior: Interior Surfaces X Cleanliness: Overall Cleanliness, Pest/ Vermin Infestation X Electrical: Electrical X Restrooms/Fountains: Restrooms, Sinks/ Fountains X Safety: Fire Safety, Hazardous Materials X Structural: Structural Damage, Roofs X External: Playground/School Grounds, Windows/ Doors/Gates/Fences X Overall Rating Poor Repair Needed and Action Taken or Planned Some areas in the gym need patching, painting and ceiling tiles replaced. Minor plumbing repairs needed in several areas Sections of the athletic field fence and grounds need to be repaired. X Note: Cells shaded in black do not require data. V. Teachers Teacher Credentials Teachers School 2008–09 With Full Credential School 2009–10 87 85 School 2010–11 District 2010–11 84 694 Without Full Credential 0 0 0 0 Teaching Outside Subject Area of Competence (with full credential) 8 1 2 10 Teacher Misassignments and Vacant Teacher Positions Indicator 2009–10 2010–11 2011–12 Misassignments of Teachers of English Learners 0 0 0 Total Teacher Misassignments* 1 2 3 Vacant Teacher Positions 1 16 18 Note: “Misassignments” refers to the number of positions filled by teachers who lack legal authorization to teach that grade level, subject area, student group, etc. * Total Teacher Misassignments includes the number of Misassignments of Teachers of English Learners. Core Academic Classes Taught by Highly Qualified Teachers (School Year 2010–11) The Federal Elementary and Secondary Education Act (ESEA), also known as No Child Left Behind (NCLB), requires that core academic subjects be taught by Highly Qualified Teachers, defined as having at least a bachelor’s degree, an appropriate California teaching credential, and demonstrated core academic subject area competence. For more information, see the CDE Improving Teacher and Principal Quality Web page at: http://www.cde.ca.gov/nclb/sr/tq/ Percent of Classes In Core Academic Subjects Taught by Highly Qualified Teachers Location of Classes Percent of Classes In Core Academic Subjects Not Taught by Highly Qualified Teachers This School 99.66% 0.34% All Schools in District 99.31% 0.69% High-Poverty Schools in District 99.31% 0.69% Low-Poverty Schools in District 100.00% 0.00% Note: High-poverty schools are defined as those schools with student eligibility of approximately 40 percent or more in the free and reduced price meals program. Low-poverty schools are those with student eligibility of approximately 25 percent or less in the free and reduced price meals program. VI. Support Staff Academic Counselors and Other Support Staff (School Year 2010–11) Title Number of FTE* Assigned to School Academic Counselor 5 Counselor (Social/Behavioral or Career Development) 0 Library Media Teacher (librarian) 1 Library Media Services Staff (paraprofessional) 0 Psychologist 2 Social Worker 0 Nurse 1 Speech/Language/Hearing Specialist 1 Resource Specialist (non-teaching) 0 Other 1 Average Number of Students per Academic Counselor 490 Note: Cells shaded in black do not require data. * One Full-Time Equivalent (FTE) equals one staff member working full-time; one FTE could also represent two staff members who each work 50 percent of full-time. VII. Curriculum and Instructional Materials Quality, Currency, Availability of Textbooks and Instructional Materials (School Year 2011–12) This section describes whether the textbooks and instructional materials used at the school are from the most recent adoption; whether there are sufficient textbooks and instruction materials for each student; and information about the school’s use of any supplemental curriculum or non-adopted textbooks or instructional materials. Year and month in which data were collected: December 2011 Core Curriculum Area Textbooks and instructional materials/year of adoption From most recent adoption? Percent students lacking own assigned copy Reading/Language Arts Holt, Rinehart and Winston, 2001 Yes 0% Mathematics McDougal Littell, 2008 Yes 0% Science Prentice Hall, 2007 Yes 0% History-Social Science McDougal Littell, 2006 McGraw-Hill, 2006 Prentice Hall, 2006 Yes 0% Foreign Language McDougal Littell, 2001 Prentice Hall, 2001 Heinie and Heinie, 2001 US International Press, 2001 Yes 0% Health N/A N/A N/A Visual and Performing Arts Glencoe, 2007 Yes 0% Science Laboratory Equipment (grades 9-12) N/A N/A N/A VIII. School Finances Expenditures Per Pupil and School Site Teacher Salaries (Fiscal Year 2009–10) Level Total Expenditures Per Pupil Expenditures Per Pupil (Supplemental / Restricted) Expenditures Per Pupil (Basic / Unrestricted) Average Teacher Salary $6,515 $1,232 $5,283 $73,796 District $5,259 $70,053 Percent Difference – School Site and District 0.46% 5.34% State $5,455 $67,667 Percent Difference – School Site and State -3.15% 9.06% School Site Note: Cells shaded in black do not require data. Supplemental/Restricted expenditures come from money whose use is controlled by law or by a donor. Money that is designated for specific purposes by the district or governing board is not considered restricted. Basic/unrestricted expenditures are from money whose use, except for general guidelines, is not controlled by law or by a donor. For detailed information on school expenditures for all districts in California, see the CDE Current Expense of Education & Per-pupil Spending Web page at http://www.cde.ca.gov/ds/fd/ec/. For information on teacher salaries for all districts in California, see the CDE Certificated Salaries & Benefits Web page at http://www.cde.ca.gov/ds/fd/cs/. To look up expenditures and salaries for a specific school district, see the Ed-Data Web site at: http://www.ed-data.org. Types of Services Funded (Fiscal Year 2010–11) This section provides information about the programs and supplemental services that are available at the school and funded through either categorical or other sources. In addition to general State funding, Alhambra Unified School District receives State and Federal categorical funding for special programs. For the 2010-11 school year, the District received approximately $1,688 per student in Federal or State aid for the following categorical, special education, and support programs: Title I Title II Title III Title IV WIA Migrant Education Lottery Instructional Materials Special Education EIA/SCE EIA/LEP VAPA Teacher and Administrative Salaries (Fiscal Year 2009–10) Category District Amount State Average For Districts In Same Category Beginning Teacher Salary $35,430 $41,035 Mid-Range Teacher Salary $66,490 $65,412 Highest Teacher Salary $97,260 $84,837 $123,067 $106,217 $0 $111,763 Average Principal Salary (High) $138,132 $121,538 Superintendent Salary $207,289 $197,275 35.00% 39.00% 5.00% 5.00% Average Principal Salary (Elementary) Average Principal Salary (Middle) Percent of Budget for Teacher Salaries Percent of Budget for Administrative Salaries Note: For detailed information on salaries, see the CDE Certificated Salaries & Benefits Web page at http://www.cde.ca.gov/ds/fd/cs/. IX. Student Performance Standardized Testing and Reporting Program The Standardized Testing and Reporting (STAR) Program consists of several key components, including: California Standards Tests (CSTs), which include English-language arts (ELA) and mathematics in grades two through eleven; science in grades five, eight, and nine through eleven; and history-social science in grades eight, and nine through eleven. California Modified Assessment (CMA), an alternate assessment that is based on modified achievement standards in ELA for grades three through eleven; mathematics for grades three through seven, Algebra I, and Geometry; and science in grades five and eight, and Life Science in grade ten. The CMA is designed to assess those students whose disabilities preclude them from achieving grade-level proficiency on an assessment of the California content standards with or without accommodations. California Alternate Performance Assessment (CAPA), includes ELA and mathematics in grades two through eleven, and science for grades five, eight, and ten. The CAPA is given to those students with significant cognitive disabilities whose disabilities prevent them from taking either the CSTs with accommodations or modifications or the CMA with accommodations. The assessments under the STAR Program show how well students are doing in relation to the state content standards. On each of these assessments, student scores are reported as performance levels. For detailed information regarding the STAR Program results for each grade and performance level, including the percent of students not tested, see the CDE STAR Results Web site at http://star.cde.ca.gov. Standardized Testing and Reporting Results for All Students – Three-Year Comparison Subject Percent of Students Scoring at Proficient or Advanced (meeting or exceeding the state standards) School 2008– 09 District 2009– 10 2010– 11 2008– 09 State 2009– 10 2010– 11 2008– 09 2009– 10 2010– 11 English-Language Arts 59% 63% 63% 56% 59% 61% 49% 52% 54% Mathematics 64% 66% 67% 59% 61% 64% 46% 48% 50% Science 60% 62% 64% 56% 58% 63% 50% 54% 57% History-Social Science 55% 56% 60% 47% 48% 52% 41% 44% 48% Note: Scores are not shown when the number of students tested is ten or less, either because the number of students in this category is too small for statistical accuracy or to protect student privacy. Standardized Testing and Reporting Results by Student Group – Most Recent Year Group Percent of Students Scoring at Proficient or Advanced English- Language Arts Mathematics Science History- Social Science All Students in the LEA 61% 64% 63% 52% All Students at the School 63% 67% 64% 60% Male 58% 64% 61% 62% Female 67% 70% 67% 58% Black or African American 0% 0% 0% 0% American Indian or Alaska Native 0% 0% 0% 0% Asian 68% 76% 68% 65% Filipino 74% 57% 73% 88% Hispanic or Latino 45% 37% 41% 41% 0% 0% 0% 0% White 59% 47% 50% 57% Two or More Races 79% 75% 82% 56% Socioeconomically Disadvantaged 57% 66% 58% 55% English Learners 19% 54% 26% 28% Students with Disabilities 24% 24% 0% 16% Students Receiving Migrant Education Services 42% 0% 0% 55% Native Hawaiian or Pacific Islander Note: Scores are not shown when the number of students tested is ten or less, either because the number of students in this category is too small for statistical accuracy or to protect student privacy. California High School Exit Examination The California High School Exit Examination (CAHSEE) is primarily used as a graduation requirement. However, the grade ten results of this exam are also used to establish the percentages of students at three proficiency levels (not proficient, proficient, or advanced) in ELA and mathematics to compute AYP designations required by the federal ESEA, also known as NCLB. For detailed information regarding CAHSEE results, see the CDE CAHSEE Web site at http://cahsee.cde.ca.gov/. California High School Exit Examination Results for All Grade Ten Students – Three-Year Comparison (if applicable) Subject Percent of Students Scoring at Proficient or Advanced School District 2008– 09 2009– 10 2010– 11 State 2008– 09 2009– 10 2010– 11 2008– 09 2009– 10 2010– 11 English-Language Arts 64% 67% 74% 55% 56% 67% 52% 54% 59% Mathematics 81% 81% 83% 70% 68% 74% 53% 54% 56% Note: Scores are not shown when the number of students tested is ten or less, either because the number of students in this category is too small for statistical accuracy or to protect student privacy. California High School Exit Examination Grade Ten Results by Student Group – Most Recent Year (if applicable) Group English-Language Arts Not Proficient Mathematics Proficient Advanced Not Proficient Proficient Advanced All Students in the LEA 33 25 41 26 30 44 All Students at the School 26 23 51 17 29 55 Male 34 24 43 19 28 53 Female 17 22 61 14 29 56 Black or African American 0 0 0 0 0 0 American Indian or Alaska Native 0 0 0 0 0 0 Asian 21 23 55 9 25 66 Filipino 8 8 83 0 67 33 Hispanic or Latino 47 22 31 49 34 17 Native Hawaiian or Pacific Islander 0 0 0 0 0 0 White 11 28 61 22 44 33 Two or More Races 35 17 48 17 39 43 Socioeconomically Disadvantaged 33 22 45 21 29 50 English Learners 69 21 9 32 32 36 Students with Disabilities 83 13 4 70 17 13 Students Receiving Migrant Education Services 0 0 0 0 0 0 Note: Scores are not shown when the number of students tested is ten or less, either because the number of students in this category is too small for statistical accuracy or to protect student privacy. California Physical Fitness Test Results (School Year 2010–11) The California Physical Fitness Test (PFT) is administered to students in grades five, seven, and nine only. This table displays by grade level the percent of students meeting the fitness standards for the most recent testing period. For detailed information regarding this test, and comparisons of a school’s test results to the district and state, see the CDE PFT Web page at http://www.cde.ca.gov/ta/tg/pf/. Grade Level Percent of Students Meeting Fitness Standards Four of Six Standards Five of Six Standards Six of Six Standards 5 0.00% 0.00% 0.00% 7 0.00% 0.00% 0.00% 9 17.80% 30.50% 37.40% Note: Scores are not shown when the number of students tested is ten or less, either because the number of students in this category is too small for statistical accuracy or to protect student privacy. X. Accountability Academic Performance Index The Academic Performance Index (API) is an annual measure of state academic performance and progress of schools in California. API scores range from 200 to 1,000, with a statewide target of 800. For detailed information about the API, see the CDE API Web page at http://www.cde.ca.gov/ta/ac/ap/. Academic Performance Index Ranks – Three-Year Comparison This table displays the school’s statewide and similar schools’ API ranks. The statewide API rank ranges from 1 to 10. A statewide rank of 1 means that the school has an API score in the lowest ten percent of all schools in the state, while a statewide rank of 10 means that the school has an API score in the highest ten percent of all schools in the state. The similar schools API rank reflects how a school compares to 100 statistically matched “similar schools.” A similar schools rank of 1 means that the school’s academic performance is comparable to the lowest performing ten schools of the 100 similar schools, while a similar schools rank of 10 means that the school’s academic performance is better than at least 90 of the 100 similar schools. API Rank 2008 2009 2010 Statewide 9 9 9 Similar Schools 6 8 8 Academic Performance Index Growth by Student Group – Three-Year Comparison Group Actual API Change 2008–09 All Students at the School Actual API Change 2009–10 Actual API Change 2010–11 22 16 5 26 11 3 8 24 -16 Socioeconomically Disadvantaged 31 22 3 English Learners 17 3 51 Black or African American American Indian or Alaska Native Asian Filipino Hispanic or Latino Native Hawaiian or Pacific Islander White Two or More Races N/D Students with Disabilities Note: “N/D” means that no data were available to the CDE or LEA to report. “B” means the school did not have a valid API Base and there is no Growth or target information. “C” means the school had significant demographic changes and there is no Growth or target information. Academic Performance Index Growth by Student Group – 2011 Growth API Comparison This table displays, by student group, the number of students included in the API and the 2011 Growth API at the school, LEA, and state level. Group 2011 Growth API Number of Students School All Students at the School 1,696 Black or African American American Indian or Alaska Native Asian Filipino Hispanic or Latino Native Hawaiian or Pacific Islander 850 Number of Students LEA Number of Students State 13,537 828 4,683,676 778 4 96 784 317,856 696 4 18 757 33,774 733 1,193 882 6,910 894 398,869 898 23 879 205 878 123,245 859 378 722 5,687 739 2,406,749 729 16 810 26,953 764 2 White 41 867 452 828 1,258,831 845 Two or More Races 41 923 131 909 76,766 836 1,072 830 9,660 808 2,731,843 726 689 796 6,342 818 1,521,844 707 83 550 1,265 608 521,815 595 Socioeconomically Disadvantaged English Learners Students with Disabilities Adequate Yearly Progress The federal ESEA requires that all schools and districts meet the following Adequate Yearly Progress (AYP) criteria: Participation rate on the state’s standards-based assessments in ELA and mathematics Percent proficient on the state’s standards-based assessments in ELA and mathematics API as an additional indicator Graduation rate (for secondary schools) For detailed information about AYP, including participation rates and percent proficient results by student group, see the CDE AYP Web page at http://www.cde.ca.gov/ta/ac/ay/. Adequate Yearly Progress Overall and by Criteria (School Year 2010–11) AYP Criteria School District Made AYP Overall Yes No Met Participation Rate - English-Language Arts Yes Yes Met Participation Rate - Mathematics Yes Yes Met Percent Proficient - English-Language Arts Yes No Met Percent Proficient - Mathematics Yes No Met API Criteria Yes Yes Met Graduation Rate Yes Yes Federal Intervention Program (School Year 2011–12) Schools and districts receiving federal Title I funding enter Program Improvement (PI) if they do not make AYP for two consecutive years in the same content area (ELA or mathematics) or on the same indicator (API or graduation rate). After entering PI, schools and districts advance to the next level of intervention with each additional year that they do not make AYP. For detailed information about PI identification, see the CDE PI Status Determinations Web page: http://www.cde.ca.gov/ta/ac/ay/tidetermine.asp. Indicator Program Improvement Status First Year of Program Improvement Year in Program Improvement School District In PI In PI 2010-2011 2008-2009 Year 1 Year 3 Number of Schools Currently in Program Improvement 7 Percent of Schools Currently in Program Improvement 38.9% Note: Cells shaded in black do not require data. XI. School Completion and Postsecondary Preparation Admission Requirements for California’s Public Universities University of California Admission requirements for the University of California (UC) follow guidelines set forth in the Master Plan, which requires that the top one-eighth of the state’s high school graduates, as well as those transfer students who have successfully completed specified college course work, be eligible for admission to the UC. These requirements are designed to ensure that all eligible students are adequately prepared for University-level work. For general admissions requirements, please visit the UC Admissions Information Web page at http://www.universityofcalifornia.edu/admissions/. (Outside source) California State University Eligibility for admission to the California State University (CSU) is determined by three factors: Specific high school courses Grades in specified courses and test scores Graduation from high school Some campuses have higher standards for particular majors or students who live outside the local campus area. Because of the number of students who apply, a few campuses have higher standards (supplementary admission criteria) for all applicants. Most CSU campuses have local admission guarantee policies for students who graduate or transfer from high schools and colleges that are historically served by a CSU campus in that region. For admission, application, and fee information see the CSU Web page at http://www.calstate.edu/admission/admission.shtml. (Outside source) Dropout Rate and Graduation Rate Indicator School 2007– 08 Dropout Rate (1year) Graduation Rate District 2008– 09 2009– 10 2007– 08 State 2008– 09 2009– 10 2007– 08 2008– 09 2009– 10 0.9 3.2 0.6 2.8 2.9 1.4 4.9 5.7 4.6 95.76 86.41 98.05 87.39 87.30 92.89 80.21 78.59 80.44 Note: The National Center for Education Statistics graduation rate as reported in AYP is provided in this table. Completion of High School Graduation Requirements This table displays, by student group, the percent of students who began the 2010–11 school year in grade twelve and were a part of the school’s most recent graduating class, meeting all state and local graduation requirements for grade twelve completion, including having passed both the ELA and mathematics portions of the CAHSEE or received a local waiver or state exemption. Group Graduating Class of 2011 School District State All Students 99.82% 96.10% N/D Black or African American N/A 100.00% N/D American Indian or Alaska Native N/A 100.00% N/D Asian 99.76% 97.16% N/D Filipino Hispanic or Latino N/D 100.00% 94.02% N/D Native Hawaiian or Pacific Islander N/A 100.00% N/D White 100.00% 97.56% N/D Two or More Races 100.00% 100.00% N/D Socioeconomically Disadvantaged 100.00% 96.00% N/D English Learners 99.42% 91.73% N/D Students with Disabilities 100.00% 92.71% N/D Note: “N/D” means that no data were available to the CDE or LEA to report. Career Technical Education Programs (School Year 2010–11) This section provides information about the degree to which pupils are prepared to enter the workforce, including a list of career technical education (CTE) programs offered at the school. The Career and Technical Education (CTE) program at Mark Keppel High School, in conjunction with Alhambra Unified School District and the community, offers students a range of options for their future. The CTE program ensures that students acquire the skills necessary to be successful in school and helps them in the transition from high school to post-secondary education and employment. Students in grades nine through twelve receive counseling from school personnel regarding progression through their selected career pathways and courses of study. The school district’s Career Preparation Department and Mark Keppel High School’s Career Center provide a variety of services, programs, and classes to assist students. The Career Center facilitates the process of students going on career-related field trips and sponsors speakers from local businesses, the community, community colleges and universities so that students are exposed to a wide variety of post-secondary options. Students may continue to research careers and colleges of interest to them using specialized computer programs and the Internet. The Regional Occupational Program (ROP) provides a significant number of CTE course offerings for the district. The ROP program is available to students 16 years or older at any school site. Through these classes students are able to earn credit for paid and unpaid work experience, explore career opportunities and learn employability skills. Local businesses frequently recruit students directly from ROP community classrooms for employment especially during the holiday season. Mark Keppel High School has two California Partnership Academies: The International Business Academy and The Architecture Academy. The academies feature an ROP class as the required CTE component. The goal is to provide at-risk students an opportunity to work in small learning communities. The school measures success of its efforts to prepare students for the work force based on student demonstrations and completion of projects. Certificates are awarded to students who successfully complete pathway programs and ROP classes. Mark Keppel High School has 21 articulation agreements with nearby community colleges. These articulation agreements support the students’ seamless transition from high school to college. In their four-year plan, all students are encouraged to explore career interest and select courses that relate to their future career goals. CTE courses offered at Mark Keppel High School are included in the following industry sectors: *Arts, Media, and Entertainment *Building Trades and Construction *Finance & Business *Health Science and Medical Technology *Hospitality, Tourism, and Recreation *Marketing, Sales, and Service *Public Services *Transportation The following is a list of CTE and ROP courses offered at Mark Keppel High School and District-wide: Accounting Explorer Tech Computer Lit/ Appl. International Bus. Media Design Business Law EC/ Entrep Graphics Design Finance Computer Kbd/ Appl. Architecture Drafting/ CAD Web Page Design Culinary Arts Auto Tech Wood Technology All courses are offered on school campuses. Career Technical Education Participation (School Year 2010–11) Measure CTE Program Participation 176 Number of pupils participating in CTE Percent of pupils completing a CTE program and earning a high school diploma 28.98% Percent of CTE courses sequenced or articulated between the school and institutions of postsecondary education 41.50% Courses for University of California and/or California State University Admission UC/CSU Course Measure Percent 2010-11 Students Enrolled in Courses Required for UC/CSU Admission 72.4% 2009-10 Graduates Who Completed All Courses Required for UC/CSU Admission 45.4% Advanced Placement Courses (School Year 2010–11) Subject Number of AP Courses Offered* Computer Science 0 English 5 Percent of Students In AP Courses Fine and Performing Arts 0 Foreign Language 2 Mathematics 6 Science 5 Social Science 7 All courses 25 5.9% Note: Cells shaded in black do not require data. *Where there are student course enrollments. XII. Instructional Planning and Scheduling Professional Development This section provides information on the annual number of school days dedicated to staff development for the most recent three-year period. Every school in the Alhambra Unified School District has always been and continues to be committed to improvement in student learning. Teachers are actively participating in standards-based professional development, assessment and strategies to help all students meet state standards. Alhambra Unified School District offers staff development opportunities to teachers, administrators, and instructional aides. Staff members build teaching skills and concepts through participation in conferences, workshops and collaboration meetings throughout the year. The District offers three staff development days where teachers participated in a broad-based variety of professional growth sessions in standards-based curriculum and instructional strategies. The District’s Professional Development Committee, consisting of administrators and teachers, meets to plan and develop the staff development for the District. Using student achievement data and results from surveys, the Committee identifies training opportunities that are aligned with the goals of the District and that will improve the learning of all students. Throughout the school year, professional development on district initiatives is provided to teachers through the use of substitutes. This includes: Thinking Maps, GATE Level II & III training, technology, problem solving. The Alhambra Unified School District offers several programs to support new and veteran teachers in their classroom skills and to ensure continued professional development. Beginning Teacher Support and Assessment (BTSA) Induction provides new teachers with assistance and support over a two-year period. The District’s Peer Assistance and Review (PAR) program is designed to assist both veteran and new teachers by providing in-class support.

