Clinical Trial Results
advertisement
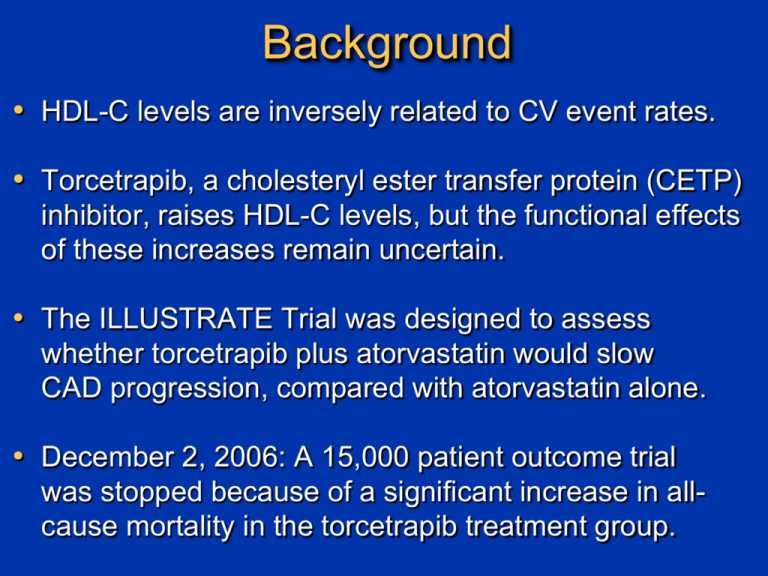
Background • HDL-C levels are inversely related to CV event rates. • Torcetrapib, a cholesteryl ester transfer protein (CETP) inhibitor, raises HDL-C levels, but the functional effects of these increases remain uncertain. • The ILLUSTRATE Trial was designed to assess whether torcetrapib plus atorvastatin would slow CAD progression, compared with atorvastatin alone. • December 2, 2006: A 15,000 patient outcome trial was stopped because of a significant increase in allcause mortality in the torcetrapib treatment group. 1188 patients at 137 centers in North America and Europe Symptomatic CAD, coronary angiography with >20% stenosis Intravascular ultrasound with 40 MHz transducer Motorized pullback at 0.5 mm/sec through >40 mm segment 4-10 week run-in atorvastatin 10-80 mg to achieve LDL-C of 100±15 mg/dL Atorvastatin monotherapy 24 months treatment Torcetrapib 60mgatorvastatin 140 patients withdrew 135 patients withdrew 446 atorvastatin patients 464 torcetrapib patients 24 Month follow-up IVUS of originally imaged “target” vessel (n=910) Ultrasound Determination of Atheroma Area Precise Planimetry of EEM and Lumen Borders EEM area Lumen area Atheroma area Intravascular Ultrasound Efficacy Parameters EEM area Change Lumen area in Percent = Atheroma Volume n AtheromaCSA n EEMCSA (Month 24) – n AtheromaCSA n EEM CSA (baseline) Atheroma area Median number AtheromaCSA – Normalized n n LumenCSA x of slices in Atheroma = Number of slices in patient’s pullback all pullbacks Volume Atheroma Volume Atheroma Volume Change in = – Atheroma Volume (baseline) (Month 24) Baseline Demographics and Medications Atorvastatin monotherapy (n=597) Torcetrapibatorvastatin (n=591) p value Age 57.0 56.9 0.96 Male 70.5% 70.4% 0.96 BMI 30.3 30.6 0.41 Current Smokers 18.8% 17.3% 0.50 History of Hypertension 77.6% 74.5% 0.21 Prior Statin Use 91.0% 90.7% 0.88 History of Diabetes Mellitus 22.3% 20.1% 0.37 Aspirin usage 94.3% 93.7% 0.68 Characteristic Titrated atorvastatin dosage 23mg in both treatment groups Baseline Lipid Levels and Blood Pressure Characteristic Atorvastatin Monotherapy (n=597) Torcetrapibatorvastatin (n=591) p value Total Cholesterol (mg/dL) 157.5 157.7 0.91 LDL-cholesterol (mg/dL) 84.3 83.1 0.35 HDL-cholesterol (mg/dL) 45.2 46.0 0.34 LDL-C/HDL-C ratio 1.90 1.88 0.39 Triglycerides (mg/dL) 123.9 122.0 0.66 C-reactive Protein (mg/L) 1.8 2.1 0.04 Systolic BP (mmHg) 120.0 119.8 0.81 Diastolic BP (mmHg) 73.4 73.3 0.70 Final Lipid Values and Percentage Change Lipid Value (mg/dL) Atorvastatin monotherapy (n=446) TorcetrapibAtorvastatin (n=464) p value* Final Value Change (%) Final Value Change (%) Total Cholesterol 157.2 1.9% 167.5 7.2% <0.001 LDL-cholesterol 87.2 6.6% 70.1 -13.3% <0.001 HDL-cholesterol 43.9 -2.2% 72.1 58.6% <0.001 LDL-C/HDL-C ratio 2.03 NA 0.93 NA <0.001 Triglycerides 110 -8.2% 104 -14.3% <0.001 C-Reactive Protein 1.5 -0.2 1.85 -0.1 0.19 Time Course: Change in LDL-C Levels LDL cholesterol Level (mg/dL) 100 Atorvastatin Monotherapy 90 Difference 19.9% 80 70 Torcetrapib-Atorvastatin 60 50 40 0 1 3 6 9 12 Time (months) 15 18 21 24 Time Course: Change in HDL-C Levels HDL-cholesterol Level (mg/dL) 90 80 Torcetrapib-Atorvastatin 70 60 Difference 60.8% 50 40 Atorvastatin Monotherapy 30 20 0 1 3 6 9 12 Time (months) 15 18 21 24 Cumulative Histogram: Change in Systolic BP Percentage of Subjects (%) 100% 80% LS Mean difference 4.6 mm Hg 60% Atorvastatin Monotherapy Torcetrapib Atorvastatin 40% 20% 0% >-20 -15 -10 -5 0 5 10 15 20 Change in Systolic Blood Pressure (mmHg) 25 Blood Pressure Related Adverse Events 30% Atorvastatin Torcetrapib 23.7% 25% 21.3% 20% 15% 10.6% 9.0% 8.2% 10% 3.2% 5% 0% Investigator reported HTN Pressure >140/90 mmHg Systolic BP Increase >15 mmHg Primary Efficacy Parameter Change in Percent Atheroma Volume 0.35 p = 0.72† 0.3 0.25 Change in percent atheroma volume 0.2 0.19 0.15 0.12 0.1 0.05 0 Atorvastatin monotherapy *LS Mean change Torcetrapibatorvastatin †p value from ANCOVA Secondary IVUS Efficacy Parameters Change in Normalized Atheroma Volume (mm3) 0 Change in 10 mm Most Diseased Segment (mm3) 0 -1 -4 -2 -3 -6.3 -8 -4 -3.3 -9.5 -5 -12 p = 0.023† -16 *LS Mean change -4.2 -6 p = 0.12† -7 †p value from ANCOVA Atorvastatin Torcetrapib Prespecified Subgroups: No Heterogeneity • Men vs. women • Age greater or less than 65 • Smokers vs. Non-smokers • LDL-C greater or less than the median • HDL-C greater or less than 40 mg/dL • hsCRP greater or less than 3.0 mg/L • Presence or absence of diabetes • Presence or absence of metabolic syndrome Subgroup With Significant Heterogeneity Baseline Percent Atheroma Volume (PAV) above/below the median 0.8 Interaction p value = 0.005 0.61 0.6 Change In Percent Atheroma Volume (%) 0.4 0.21 0.2 0.19 0 -0.2 -0.4 -0.37 -0.6 PAV <median Atorvastatin monotherapy PAV іmedian Torcetrapib-atorvastatin Adverse Events: Safety Population (n=1188) Atorvastatin Monotherapy (n=597) TorcetrapibAtorvastatin (n=591) Death 6 (1.0%) 8 (1.4%) CHD death 1 (0.2%) 1 (0.2%) 16 (2.7 %) 13 (2.2%) Fatal or nonfatal stroke 8 (1.3%) 2 (0.3%) Hospitalization for unstable angina 34 (5.7%) 47 (8.0%) Coronary revascularization 95 (15.9%) 114 (19.3%) Peripheral vascular disease 13 (2.2%) 10 (1.7%) Hospitalization for CHF 4 (0.7%) 9 (1.5%) Composite: CHD death, MI, stroke, and unstable angina 57 (9.5%) 62 (10.5%) 117 (19.6%) 124 (21.0%) Nonfatal myocardial infarction Composite: CHD death, MI, stroke, unstable angina, and revasculariztion Relationship between LDL-C and Percent Atheroma Volume in Six Recent IVUS Trials 1.8 CAMELOT placebo 1.2 REVERSAL pravastatin ACTIVATE placebo Change 0.6 in Percent Atheroma Volume 0 (%) ILLUSTRATE torcetrapib REVERSAL atorvastatin A-Plus placebo ILLUSTRATE Atorvastatin -0.6 ASTEROID rosuvastatin -1.2 50 60 70 80 90 100 110 Mean Low-Density Lipoprotein Cholesterol (mg/dL) 120 Conclusions • Torcetrapib 60mg in combination with atorvastatin increased HDL-C by 61% and lowered LDL-C by 20%, compared with atorvastatin monotherapy. • However, torcetrapib also increased systolic blood pressure by an average of 4.6 mmHg. • Torcetrapib-atorvastatin did not reduce the progression of coronary atherosclerosis for the primary efficacy parameter, compared with atorvastatin alone. • Adverse events showed a numerical excess in the torcetrapib group, but these differences did not reach statistical significance (trial not powered for outcomes). Failure of Torcetrapib: Interpretation The absence of a beneficial effect for torcetrapib was particularly striking for the achieved LDL level of 70 mg/dL, 20% lower than atorvastatin monotherapy. 1) CETP inhibition may not generate HDL particles that function normally in facilitating reverse cholesterol transport. 2) The torcetrapib-mediated increase in BP may have counterbalanced any favorable effects on lipid levels. 3) The increased BP may reflect a more generalized toxicity, simultaneously preventing beneficial effects on progression and increasing adverse clinical outcomes. Some Final Thoughts In 20 years since introduction of statins, no new classes of anti-atherosclerotic drugs have been introduced. We continue to believe that raising drugs to raise HDL-C levels represents promising therapeutic targets. It remains uncertain whether the unfavorable torcetrapib results were due to the “molecule” or the “mechanism” Although discouraging, we do not think these results preclude the possibility that another CETP inhibitor will produce favorable effects, but they do “raise the bar.”
