Chapter-7-Pelagic-Ecosystems-Slideshow
advertisement
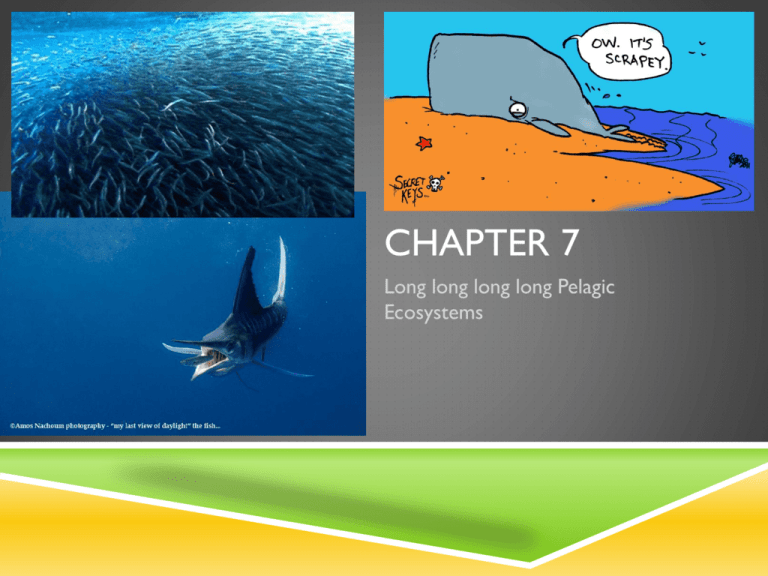
CHAPTER 7 Long long long long Pelagic Ecosystems REVIEW Pelagic? Largely open, unbounded environment Large range of freedom to move in three dimensions Largest habitat on earth Extremely variable in temperature, salinity, turbidity, biomass, etc. Human effects Global climate change 90% of stocks of large pelagic fish (tuna) removed by fishing Zooplankton communities shift in spatial distribution Microscopic plastic fragments widespread and cause a variety of problems Regime shifts—ecological step-changes MORE ZONE REVIEW Pelagic zone—sea surface to just above the seabed 99.5% of the earth’s habitable space Made up of the neritic and oceanic zones Neritic Makes up 8% of the earth’s total sea area Limited by the 200m depth contour (isobath) Oceanic 92% total sea area 65% earth’s surface Characterized by ‘Case 1’ and ‘Case 2’ waters Benthic zone CASE 1 AND 2 WATERS Case 1—ocean color is determined by algal pigments Example of ocean coloring? Case 2—ocean color is due to reflections from particulate matter Difference in particulate loading can lead to differences in underwater light climate Have led to varying photosynthetic processes in neritic and oceanic phytoplankton European flying squid and diatoms http://www.youtube.com/watch?v=dwYr1TJbue0 MORE ZONES YAY Neustic zone—upper surface of the ocean Harsh envionment due to high levels of ultraviolet radiation Organisms are typically blue because protective pigments in the color reflect the damage Ozone hole in earth’s atmosphere may cause UV damage to multiple creatures, including Antarctic krill Photic zone—upper layer of the water column into which light penetrates top 200 meters Epipelagic zone Also upper 200 meters of the water column Red light doesn’t penetrate far in this zone Many organisms have some sort of red coloring to protect against predators CHANGES WITH DEPTH Organisms are faced with increasing pressure How much at 2 meters? Oxygen minimal layers—due to bacteria breaking down marine snow Total mass of biota per unite volume of seawater decreases Because biological processes are fueled by photosyntetically generated organic matter from the surface http://www.youtube.com/watch?v=vsLBOkYLLeI Food availability decreases—more distance Energy efficiency become more important Biological pump - http://www.youtube.com/watch?v=nM4SjToMgkM PELAGIC INHABITANTS Plankton can’t move horizontally, but they can move vertically DVM—diel vertical migration Driven primarily by escape from predators and search for food Also known as…? Holoplankton—spend their entire life as plankton Meroplankton—only spend part of their life as plankton Planktotrophic larvae—have an extended planktic phase have a higher mortality rate than lecithotrophic larvae Will have a larger genetic dispersal though PELAGIC INHABITANTS CONT. Smaller organisms tend to be plankton, not nekton Exception—lion’s mane jellyfish Occurs usually because of the interaction between size and viscosity More energy is required for them to keep moving Microbial loop—fuels the pelagic food chain, especially in oligotrophic waters http://www.youtube.com/watch?v=qybUFnY7Y8w - cascades TEMPORAL AND SPATIAL VARIABILITY Variability due to interactions between physical and biological processes Graphed using the Stommel diagram Shows variations between the interplay of these two factors Space vs. time PHYSICAL PROCESSES What causes changes in… Light? Mixing? Temperature? Density? Nutrient and gas concentration? Langmuir circulation—small scale upwelling http://faculty.gvsu.edu/videticp/langmuir.htm Cause near-surface vortexes Alternating lines of upward divergance and downward convergence develop Can lead to the accumulation of zooplankton and flotsam EKMAN STUFF Coriolis effect—force of the earth spinning causes water blown by the wind to move 90º to the wind Right of the wind in northern hemisphere, left in southern hemisphere Ekman transport—movement of the water pushed by the wind left or right depending on the hemisphere Front—horizontal boundary between water masses with different physical propterties “meanders in fronts” –core rings—important for transoceanic mixing UMM…OCEAN STUFF (HOW PRODUCTIVITY IS AFFECTED) Mixed-layer depth—the depth to which water-column mixing occurs Problematic for phytoplankton because they may be carried below the compensation depth, where they can’t get light May eventually inhibit phytoplankton growth though if vertical stratification prevents mixing for too long Upwelling regions Nutrients not normally limited annual primary production is high Exception: El Nino http://www.esrl.noaa.gov/psd/map/clim/sst_olr/sst_anim.shtml OTHER REGIONS AND SUCKY STUFF HNLC—high nutrient, low chlorophyll Southern Ocean and equatorial Pacific Due to grazing pressure and absence of trance elements, especially iron (Iron Hypothesis) Since 1999, global ocean primary productivity has fallen 0.19 Pg C per year Pg C=petagram=1015 grams=1 billion metric tons Mostly occurring in low-latitude oceans (45ºN to 45ºS) Due to strengthening stratification limiting nutrients Increasing gin mixing and nutrient replenishment in the polar regions are unlikely to counteract middle-latitude production Smetacek’s theory—that whales are keystone species in southern oceans Krill capture iron Whales eat krill, keeping iron from sinking below use Whales return iron to the environment, and phytoplankton use it for the krill to eat BIOMES Biome—the largest coherent community unit that is convenient to recognize (lazy scientists) Categorized into four different groups characterized by the mechanisms driving their mixed layer depth Westerlies biome—local winds and irradiance force the mixed layer depth Trades biome—mixed layer depth is influenced by large-scale ocean circulation processes Polar biome—buoyant fresh water from ice melt in spring constrains the layer Coastal biome—diverse procecsses like upwelling (Provinces—allow regional differences in physical oceanography that help make predictions and gain understanding) PRIMARY PRODUCTION TO NEKTON GLOBEC—global research effort to understand interactions between primary consumers, higher trophic levels, and fisheries Direct linear relationship between the magnitude of annual primary production and nekton production Many zooplankton populations are bottom-up controlled Zooplankton blooms can’t occur unless phytoplankton biomass and production is sufficient Temperate waters—zooplankton spike in spring and autumn High latitudes—limited to spring/summer peak and stay dormant in diapause Spatial segregation allows higher overall biomass to be maintained, versus homogenous phytoplankton and grazers everywhere SAMPLING THE OPEN OCEAN Extreme horizontal, vertical, temporal patchiness, and huge siz-erange of organisms makes it difficult to get quantitative samples Early studies used mostly fishing nets Presently, nets have depth, temperature, salinity and other sensors that can convey where the area of interest is back to the ship OPCs—used instead of nets to obtain espimates of zooplankton numerical density Can also use echo-sounders to detect and quantify abundance zooplankton and fish Larger organisms that come to the sea surface can be counted by observers OTHER METHODS Sampling platforms with moored instruments AUVs Gliders Vertically-profiling floats Earth-orbiting satellites Give almost weekly information on sea surface temperature, chlorophyll concentration, and front position Can also track the movements of larger animals Can be used to reduce bycatch PELAGIC FISHERIES Amount the most sustainable and least damaging to the environment Rates of bycatch are minor compared to other kinds of fisheries Mostly going after shoaling species Atlantic mackerel North Sea herring Lantern fish (Myctophids) …and planktivorous forage fish Sardine and anchovy Create wasp-waist ecosystems—one or a couple species of small planktivorous fish dominate their trophic level CONTROVERSY OVER PELAGIC FISHING Analyses of long-line data suggests that 90% of large pelagic fish may have been removed before management procedures developed People argue the limits for fisheries are incredibly low because they represent already-depleted stock levels Makes restoration of stocks difficult We don’t know what the pre-exploitation biomass was Can’t calculate when restoration is completed Long-line fishing is the major factor in substantial declines in albatross populations Take the baited hooks when thrown from the ship and drown as they sink FISHING SQUID Also called “jigging” Jig—hooked coloed lures with extremely bright lights Lights can be so bright that satellites can detect them—may help to monitor and manage open-ocean squid fisheries Why do we care? Squid respond rapidly to changing oceanographic conditions May help predict interannual variations in recruitment REGIME SHIFT Typically take less than one year to occur—may last for decades Driven by: Climatic changes fishing pressure Or both Present major challenges for scientists attempting to manage fisheries Can be measured using CPRs(Continuous Plankton Recorder) Example of regime shift—influx in the population of plankton in the North Sea due to an increase in nutrient-rich Atlantic water SUSPECTED REGIME SHIFTS Increase in jellyfish population in many pelagic marine ecosystems Possibly in response to climate and fishing effects How could that be? Hint: turtles Correlation between abundance in jellyfish and NAOI (North Atlantic Oscillation) Also compete with herring(overfished) for zooplankton food Jelly-fish dominated pelagic communities may be one consequence of overexploitation of fish stocks Scientists have detected more regime shifts since the 1990’s Incidence of regime shifts may be increasing or… We may just be able to detect more changes FUTURE OF PELAGIC ECOSYSTEMS Down the food web—as traditional fish species are removed, fishing effort turns to smaller species ever-increasing human population and demand for food protein Fisheries have gradually been moving farther and farther from shore We still suck: Removing biomass through fishing Incidence of waste is increasing and pushing species beyond their usual range Alien species have devastating effects on pelagic ecosystems Ex: ctenophore—native of eastern USA, led to the collapse of the Black Sea anchovy fishery because it preys on fish eggs WE SUCK SO BAD Could dump CO2 out at sea to reduce further increasing in atmospheric concentrations Ocean sound Low-frequency noise from shipping oil-exploitation, and military activities may significantly impact cetacean communication and foraging by masking their sounds Killer Whales have increased the length of their calls by about 15%, probably attempting to overcome noise generated by boats Sound underwater and ocean acidification Propagation of underwater sound in the range of frequencies used for cetacean communications will increase as the ocean becomes more acidic Changes in ocean acidity could enable sounds to travel up to 70% farther Will increase the levels of background noise and may affect marine mammal behavior CLIMATE CHANGE The likely state of aquatic ecosystems in 2025 will be due singularly to climate warming Have already had impacts on sea-ice extent and zooplankton distribution Could result in multiple extinctions before the end of the century Largest threat: increased warming and consequent freshening of the Artic may switch off the North Atlantic Current (NAC) and damage global ocean circulation Could reduce north Atlantic plankton biomass by more than half Could reduce global export production by more than 20% http://www.youtube.com/watch?v=kxPwbhFeZSw GOOD (SORT OF) VIDEOS TO WATCH http://www.youtube.com/watch?v=TgNeL7igtnw http://www.youtube.com/watch?v=8101vCjM7nY http://www.youtube.com/watch?v=5cqCvcX7buo&list=PLE5E6A5688B2 CB642
