Internal Audit & Analysis
advertisement
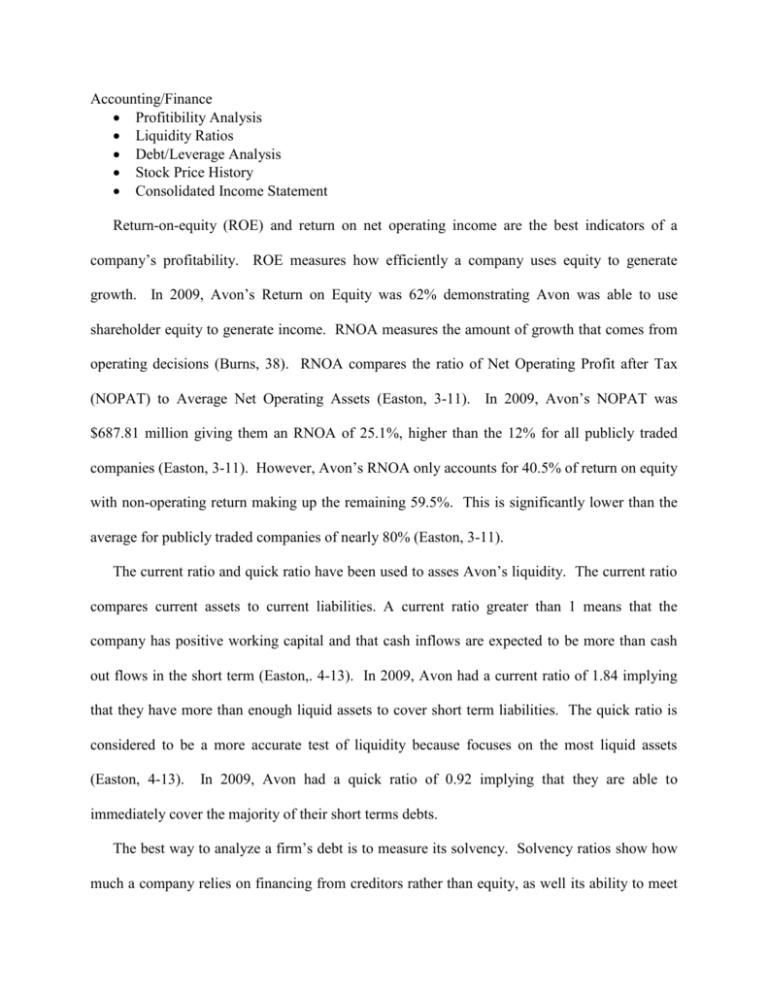
Accounting/Finance Profitibility Analysis Liquidity Ratios Debt/Leverage Analysis Stock Price History Consolidated Income Statement Return-on-equity (ROE) and return on net operating income are the best indicators of a company’s profitability. ROE measures how efficiently a company uses equity to generate growth. In 2009, Avon’s Return on Equity was 62% demonstrating Avon was able to use shareholder equity to generate income. RNOA measures the amount of growth that comes from operating decisions (Burns, 38). RNOA compares the ratio of Net Operating Profit after Tax (NOPAT) to Average Net Operating Assets (Easton, 3-11). In 2009, Avon’s NOPAT was $687.81 million giving them an RNOA of 25.1%, higher than the 12% for all publicly traded companies (Easton, 3-11). However, Avon’s RNOA only accounts for 40.5% of return on equity with non-operating return making up the remaining 59.5%. This is significantly lower than the average for publicly traded companies of nearly 80% (Easton, 3-11). The current ratio and quick ratio have been used to asses Avon’s liquidity. The current ratio compares current assets to current liabilities. A current ratio greater than 1 means that the company has positive working capital and that cash inflows are expected to be more than cash out flows in the short term (Easton,. 4-13). In 2009, Avon had a current ratio of 1.84 implying that they have more than enough liquid assets to cover short term liabilities. The quick ratio is considered to be a more accurate test of liquidity because focuses on the most liquid assets (Easton, 4-13). In 2009, Avon had a quick ratio of 0.92 implying that they are able to immediately cover the majority of their short terms debts. The best way to analyze a firm’s debt is to measure its solvency. Solvency ratios show how much a company relies on financing from creditors rather than equity, as well its ability to meet debt obligations (Easton, 4-14). The liability to equity ratio is most commonly used to measure solvency. The median is slightly less than 1.0 for public traded companies (Easton, 4-14). In 2009, Avon had a ratio of 4.21 which shows that they carry a significantly higher amount of debt over equity. Investors and creditors tend to view this as a bad sign. The long-term debt to equity ratio is also used to measure solvency and distinguishes between operating liabilities and debt obligations. It assumes current liabilities will be paid from current assets (Easton, 4-15). The liquidity ratios indicate that this is true in Avon’s case. In 2009, Avon’s ratio was 1.76 showing that the majority of their debt is short term and likely to be covered. However, their long term debt is still in excess of its equity which may still make investors and creditors anxious. Financial leverage is the most important measure of leverage (Bhayani, 43). It compares the ratio of earnings before interest and taxes (EBIT) to net income and measures the percent change in operating income for each one percent change in net income (Bhayani, 45). In 2009, Avon’s financial leverage was 1.62. Therefore, an estimated 1.62% increase in operating income is needed to produce a 1% increase in net income. A second measure, operating leverage, determines how significant a company’s fixed costs are in relation to net operating profits and revenue (Kelly and Sussman, 34). The higher the financial leverage, the more net operating profits will increase or decrease with revenue. In 2009, Avon’s operating leverage was 6.38 implying that Avon’s profits are very sensitive to changes in sales. Stock prices have increased over the past three years. However, the amount and rate at which it has increased has been declining. Year 2006 2007 2008 2009 Stock Price $183.5 $184.7 $185.6 $186.1 Consolidated Income Statement: Year ended December 31 (in millions) Net Sales Other revenue Total revenue Costs, expenses and other: Cost of sales SGA expenses Operating profit Interest expense Interest income Other expense, net Total other expenses Income before taxes Income taxes Net income NI attributable to non-controlling interests NI attributable to Avon Earnings per share: Basic Diluted Weighted-average shares outstanding: Basic Diluted 2009 $10,284.70 $98.10 $10,382.80 $3,888.30 $5,476.30 $1,018.20 $104.80 $(20.20) $7.10 $91.70 $926.50 $298.30 $628.20 $ (2.40) $625.80 $1.45 $1.45 426.90 428.54 References 1. Bhayani, Sanjay J. Impact of Financial Leverage on Cost of Capital and Valuation of Firm: A Study of Indian Cement Industry. Paradigm. Ghaziabad: Jul-Dec 2009. Vol. 13, Issue. 2, pg. 43-49. 2. Burns, David C., Sale, Timothy, and Stephan, Jen A. A Better Way to Gauge Profitability. Journal of Accountancy; Aug 2008; 206, 2; pg. 38. 3. Easton, Peter D. Financial Statement Analysis and Valuation. 2nd Edition. Cambridge Business Publishers: 2010. 4. Kelly, Eamon M. and Sussman, Richard M. Operating Leverage: A Clarification. National Association of Accountants. NAA Management Accounting (pre-1986). New York: Oct 1966. Vol. 48, Issue 2, pg. 34.

