Supplemental Material for "Histone H3 K27 acetylation marks a
advertisement
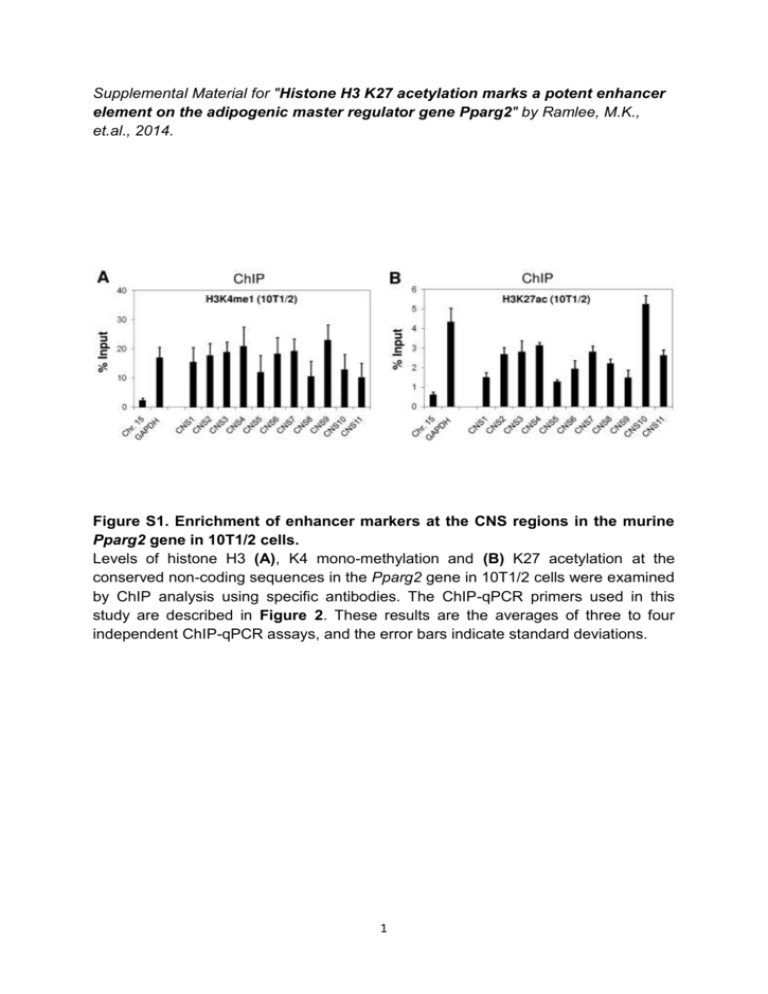
Supplemental Material for "Histone H3 K27 acetylation marks a potent enhancer element on the adipogenic master regulator gene Pparg2" by Ramlee, M.K., et.al., 2014. Figure S1. Enrichment of enhancer markers at the CNS regions in the murine Pparg2 gene in 10T1/2 cells. Levels of histone H3 (A), K4 mono-methylation and (B) K27 acetylation at the conserved non-coding sequences in the Pparg2 gene in 10T1/2 cells were examined by ChIP analysis using specific antibodies. The ChIP-qPCR primers used in this study are described in Figure 2. These results are the averages of three to four independent ChIP-qPCR assays, and the error bars indicate standard deviations. 1 2 Figure S2. Histone H3 occupancy and chromatin state at the eleven CNS in the murine Pparg2 gene in 3T3-L1 cells. (A) Rabbit IgG was included in the ChIP assay as a negative control. (B) Histone H3 occupancy and levels of histone (C) H3 K9/K14 acetylation; (D) H3 K9 trimethylation; (E) H3 K4 di-methylation; (F) H4 K12 acetylation; (G) H3 K4 trimethylation; (H) H4 K20 mono-methylation; and (I) H3 K27 tri-methylation at the eleven CNS in the Pparg2 gene in 3T3-L1 cells were examined by ChIP analysis using specific antibodies. The ChIP-qPCR primers used in this study are described in Figure 2. These results are the averages of three to four independent ChIP-qPCR assays, and the error bars indicate standard deviations. 3 4 Figure S3. Histone H3 occupancy and chromatin state at the eleven CNS in the murine Pparg2 gene in 10T1/2 cells. (A) Rabbit IgG was included in the ChIP assay as a negative control. (B) Histone H3 occupancy and levels of histone (C) H3 K9/K14 acetylation; (D) H3 K9 trimethylation; (E) H3 K4 di-methylation; (F) H4 K12 acetylation; (G) H3 K4 trimethylation; (H) H4 K20 mono-methylation; and (I) H3 K27 tri-methylation at the eleven CNS in the Pparg2 gene in 10T1/2 cells were examined by ChIP analysis using specific antibodies. The ChIP-qPCR primers used in this study are described in Figure 2. These results are the averages of three to four independent ChIP-qPCR assays, and the error bars indicate standard deviations. Figure S4. Effects of PPAR2 and RXRα overexpression on the enhancer activity of the Pparg2 CNS10 and CNS10A. The firefly luciferase reporter vectors containing the Pparg2 promoter only or the Pparg2 promoter plus CNS10 / 10A with or without the p300 binding site deletion were transfected into 10T1/2 cells along with a renilla luciferase vector (pRLTK) as an internal control. In addition, these cells were simultaneously transfected with the plasmid overexpressing PPAR2 or RXRα either individually or in combination to examine the effects of these regulators on the enhancer activity of CNS10 and CNS10A. The activities of both firefly and renilla luciferases were measured 48 hours after transfection. These results are the averages of three to six independent luciferase assays, and the error bars represent standard deviations. 5 Table S1. Primers for ChIP-qPCR. Primer Sequences (5’ - 3’) Chr.15-F Chr.15-R GAPDH-F GAPDH-R Pparg2 CNS1-F Pparg2 CNS1-R Pparg2 CNS2-F Pparg2 CNS2-R Pparg2 CNS3-F Pparg2 CNS3-R Pparg2 CNS4-F Pparg2 CNS4-R Pparg2 CNS5-F Pparg2 CNS5-R Pparg2 CNS6-F Pparg2 CNS6-R Pparg2 CNS7-F Pparg2 CNS7-R Pparg2 CNS8-F Pparg2 CNS8-R Pparg2 CNS9-F Pparg2 CNS9-R Pparg2 CNS10-F Pparg2 CNS10-R Pparg2 CNS11-F Pparg2 CNS11-R AGCGTGGCCTTGGCAGCAAA TGCGATTGGCTTCCTCTCCCC TCCAGCTGGGTGCCGGAAGT TCAAGCCCCACCCTCCGCAT TCCTCGGACT CATGCTCAAT ATGC GATGCGTTTCCATTGCTCAACCAG GT TCAACCTTGC CTAACCTAGC AC GTTACTCACTCAGTGCTTAATTGC CCCATCTGGA GAGTTAAGAC ACTG TTAGAGATGGTCCAGGAAAGCTGC CTGT GTGGCTCAGG GTTAGAGCC AGGTGCCAGGTTATCAACAGGG GGCCCCCGATCATGCTTTAGAAGGA ATTCCAGCAGTGTGCCCCAGC GTCTAGGAAAGTTTGCCAACACTGCT TGTTGCAGTGCCTGTAAGTGCT AGGGCTGTGAAAGCTAAGATTTGC AATTGGTCATCCACTACGCTGAGC AGGGTGATGGACCAGGGCAGA ACCCAGACTTGCCCCTTCAGCT GCTCTTGTTAATTCAGAGAAGCTTGG AGTTTCTCTGTCACTCAGACAGC TGAGGCAGACAGGACTGAAAGTGG TGGTGCCCATCTGGAAGGCTGC GCCTTAACTTCCTTATCAGCTCCC TTTGACTGGCAGGATGGAGTGGAG 6 Product Size 138 bp References 1 106 bp 1 144 bp This study 172 bp This study 195 bp This study 154 bp This study 88 bp This study 118 bp This study 204 bp This study 135 bp This study 138 bp This study 180 bp This study 160 bp This study Table S2. Primers for plasmid construction. Primer Pparg2 P-F Pparg2 P-R CNS1-F CNS1-R CNS2-F CNS2-R CNS3-F CNS3-R CNS4-F CNS4-R CNS5-F CNS5-R CNS6-F CNS6-R CNS7-F CNS7-R CNS8-F CNS8-R CNS9-F CNS9-R CNS10-F CNS10-R CNS11-F CNS11-R CNS10A-R CNS10B-F CNS10B-R CNS10C-F CNS10C-R CNS10D-F ∆GR-F ∆GR-R ∆C/EBPβ-F ∆C/EBPβ-R ∆p300-F ∆p300-R ∆p300-F2 ∆p300-R2 Sequence (5' - 3') TTTTTTGGTACCGGATAGCAGTAACATTTTGGACC AAAGATCTTGGTTGGTTAAAGGAAAAAGGC AAAAAGACGTCAGTTCTGCAAGCAACCCTAAGTAACC AAAAGTCGACGACAGTTTAAATATCCCCCATAGAAG AAAAAGACGTCAAGCGGTCACACTGCATGTT AAAAGTCGACAGAGAGAGTAACCAGAGTCCCAT TTTTTGACGTCCTGTCTAAAGACTTTCTTGAAAGATTG TTTTGTCGACCTCCCTTTCCCTTTCTGTATTCTGGG TTTTTGACGTCGTGGCTGACTGACAGATCATCA TTTTGTCGACGCATCTGGCATCCATTCTGCTA AAAAAGACGTCTTTCAACTACATAAATAAATAAGAC AAAAGTCGACTTTCACCTCTTAGACACTGAGCAC AAAAAGACGTCGTCAGTCCCTTTAAAGGCAAGAG AAAAGTCGACTAAACCACAGAAAATATGTTTTATATC TTTTTGACGTCAATAGCTATTAAGCTGCTTTAAGG TTTTGTCGACGCTTTGTTTAGCTGTAAGTGTAGG TTTTTGACGTCACTGTACTGCTTTGGCATAACGA TTTTGTCGACTCACACCCAGGAAGACTGTACC AAAAAGACGTCCGGTGCACCCTCTAGTCTTACTG AAAAGTCGACTAGGTGGTTGGCAGAAGCCGGAC TTTTTGACGTCATCATCTCGGGACTGAGCAA TTTTGTCGACTGCCCAACCTCTCTGTTAGG TTTTTGACGTCTCCTAGATGTGCGGTTGCAGC TTTTGTCGACGTATCTCTTTCCCTTTGGGTTTTG TTTTGTCGACGTGACTCAGCAGTTCCACTT TTTTTGACGTCTCCTGTCCACACTGGCAGC TTTTGTCGACTGCTCTGAAAAGCCACATCTC TTTTTGACGTCCTTTATCATTTTGGACTCTCAAA TTTTGTCGACCCCATCTGGAAGGCTGCCT TTTTTGACGTCCACCATTCAGCTGCAAGTGGG CTGAGCAAACAGCTGAGGCAGACAG CTGTCTGCCTCAGCTGTTTGCTCAG CATCATCTCGGGAACAGTGTTGTCTG CAGACAACACTGTTCCCGAGATGATG GAACTGCTGAGTTGTCCACACTGGC GCCAGTGTGGACAACTCAGCAGTTC GAACTGCTGAGTGTCGACCGATGCC GGCATCGGTCGACACTCAGCAGTTC 7 References This study This study This study This study This study This study This study This study This study This study This study This study This study This study This study This study This study This study This study Table S3. Plasmids. Plasmid pKR01 pKR11 pKR12 pKR13 pKR14 pKR15 pKR16 pKR17 pKR18 pKR19 pKR20 pKR21 pKR22 pKR23 pKR24 pKR25 pKR26 pKR40 pKR41 pKR42 pKR43 pKR44 pKR45 Purpose Parental vector with 6 additional cloning sites Pparg2 0.6 kb promoter only Test regulatory activity of CNS1 Test regulatory activity of CNS2 Test regulatory activity of CNS3 Test regulatory activity of CNS4 Test regulatory activity of CNS5 Test regulatory activity of CNS6 Test regulatory activity of CNS7 Test regulatory activity of CNS8 Test regulatory activity of CNS9 Test regulatory activity of CNS10 Test regulatory activity of CNS11 Test regulatory activity of CNS10A Test regulatory activity of CNS10B Test regulatory activity of CNS10C Test regulatory activity of CNS10D Test role of putative GR binding site on CNS10 Test role of putative C/EBPβ binding site on CNS10 Test role of putative p300 binding site on CNS10 Test role of putative GR binding site on CNS10A Test role of putative C/EBPβ binding site on CNS10A Test role of putative p300 binding site on CNS10A References 1 This study This study This study This study This study This study This study This study This study This study This study This study This study This study This study This study This study This study This study This study This study This study Table S4. Primers for RT-qPCR. Primer Sequences (5’ - 3’) 36B4-F AGATGCAGCAGATCCGCAT 36B4-R GTTCTTGCCCATCAGCACC Pparg2-F AACTCTGGGAGATTCTCCTGTTGA Pparg2-R TGGTAATTTCTTGTGAAGTGCTCATA p300-F TTCAGCCAAGCGGCCTAAA p300-R CGCCACCATTGGTTAGTCCC References 8 2 2 3 Table S5. Pparg2 CNS regions as potential enhancers in various lineages. Supplemental References 1. Zhang Q, Ramlee MK, Brunmeir R, Villanueva CJ, Halperin D, Xu F. Dynamic and distinct histone modifications modulate the expression of key adipogenesis regulatory genes. Cell Cycle 2012; 11:4310-22. 2. Waki H, Park KW, Mitro N, Pei L, Damoiseaux R, Wilpitz DC, et al. The small molecule harmine is an antidiabetic cell-type-specific regulator of PPARgamma expression. Cell Metab 2007; 5:357-70. 3. Wang X, Spandidos A, Wang H, Seed B. PrimerBank: a PCR primer database for quantitative gene expression analysis, 2012 update. Nucleic Acids Res 2012; 40:D1144-9. 9
