Pre-Calculus Review Sheet 5.1-5.3 Name__________________
Pre-Calculus Review Sheet 5.1-5.3
Lesson 5.1:
Name__________________
1.
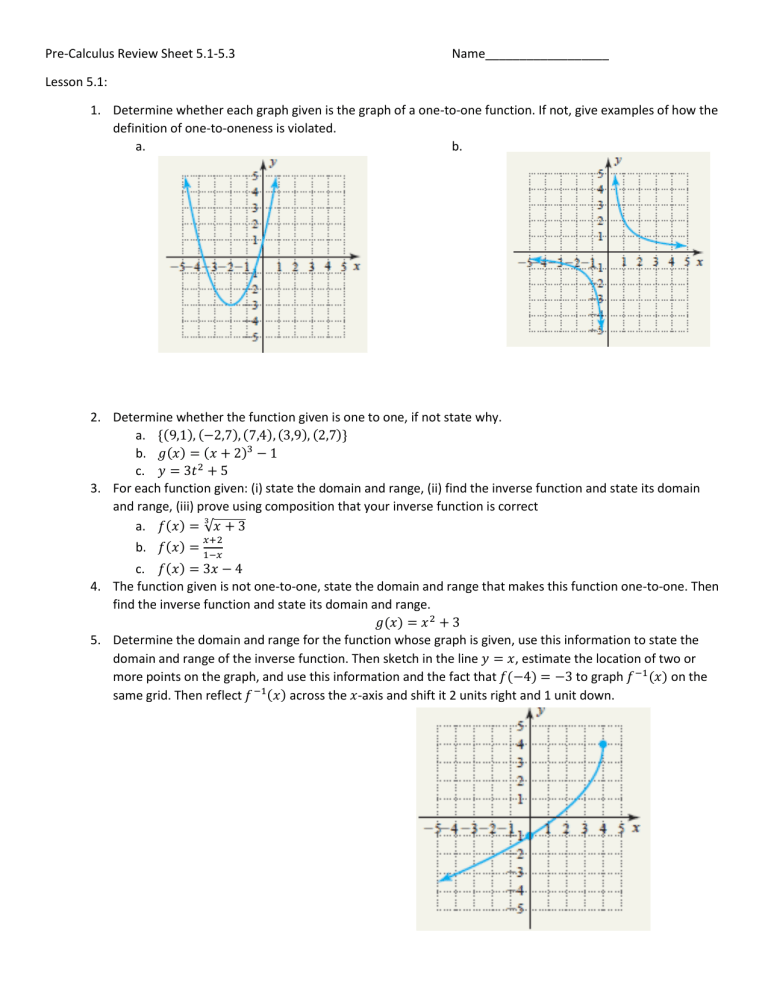
Determine whether each graph given is the graph of a one-to-one function. If not, give examples of how the definition of one-to-oneness is violated. a.
b.
2.
Determine whether the function given is one to one, if not state why. a.
{(9,1), (−2,7), (7,4), (3,9), (2,7)} b.
𝑔(𝑥) = (𝑥 + 2) 3 c.
𝑦 = 3𝑡
2
+ 5
− 1
3.
For each function given: (i) state the domain and range, (ii) find the inverse function and state its domain and range, (iii) prove using composition that your inverse function is correct a.
𝑓(𝑥) = √𝑥 + 3 b.
𝑓(𝑥) = 𝑥+2
1−𝑥 c.
𝑓(𝑥) = 3𝑥 − 4
4.
The function given is not one-to-one, state the domain and range that makes this function one-to-one. Then find the inverse function and state its domain and range. 𝑔(𝑥) = 𝑥 2 + 3
5.
Determine the domain and range for the function whose graph is given, use this information to state the domain and range of the inverse function. Then sketch in the line 𝑦 = 𝑥 , estimate the location of two or more points on the graph, and use this information and the fact that 𝑓(−4) = −3 to graph 𝑓
−1
(𝑥) on the same grid. Then reflect 𝑓
−1 (𝑥) across the 𝑥 -axis and shift it 2 units right and 1 unit down.
Lesson 5.2:
6.
Evaluate the function 𝑔(𝑥) = (
7.
Graph the function, 𝑓(𝑥) = 3
4
−𝑥
9
) 𝑥
for
− 2 𝑥 = 0, 𝑥 = 3, 𝑥 =
3
2
, 𝑥 = −2 .
, by translating the basic function 𝑦 = 3 𝑥
, sketching the asymptote, and strategically plotting a few points to round out the graph. Clearly state the basic function and what shifts are applied.
8.
Algebraically solve for x a.
3 2𝑥−1 b.
2
−2𝑥
= 27
1
= (
32
) 𝑥−3 c.
𝑒 𝑥 ∙ 𝑒 𝑥+1 = 𝑒 6 d.
(𝑒 2𝑥−3 ) 4
= 𝑒 𝑥+5 𝑒 3
Lesson 5.3
9.
Write each equation in exponential form. a.
2 = log
3 b.
1
2
= log
81
9
9 c.
log
4
16 = 2 d.
1 = ln 𝑒
10.
Write each equation in logarithmic form. a.
2
−3
=
1
8 b.
(
1
)
−2 c.
𝑒
5
1
= 𝑒
= 25 d.
4
−
3
2
=
1
8
11.
Determine the value of each logarithm without using a calculator a.
log
9
9 = 𝑦 b.
log c.
ln
81
1
9 = 𝑦
= 𝑦
√𝑒
12.
Graph the function 𝑓(𝑥) = log
8
(𝑥 − 2) + 3 , using transformations and strategically plotting a few points.
Clearly state the transformations applied. A table of values might be helpful.
