Columbia Basin Water Mounds
advertisement
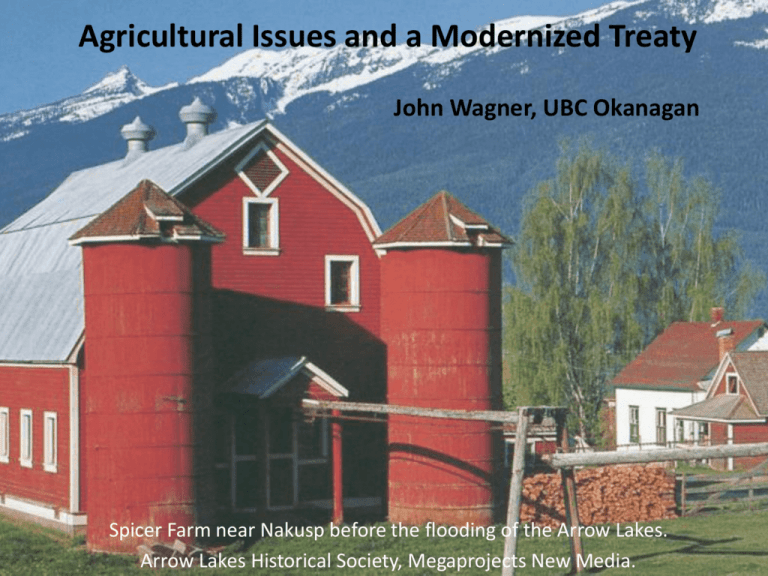
Agricultural Issues and a Modernized Treaty John Wagner, UBC Okanagan Spicer Farm near Nakusp before the flooding of the Arrow Lakes. Arrow Lakes Historical Society, Megaprojects New Media. Water Governance and Agriculture in the Columbia River Basin A pilot project funded by a Social Sciences and Humanities Research Council Insight Development Grant Creston Valley in British Columbia Moses Lake region in Washington State Source: adapted from a map created by US Army Corp of Engineers. The Spicer’s market garden overlooking Arrow Lake Source: Arrow Lakes Historical Society. Megaprojects New Media. Spicer farm 2004 Source: Arrow Lakes Historical Society. Megaprojects New Media. Nakusp waterfront 2004 Source: Arrow Lakes Historical Society. Megaprojects New Media. 25,000 acres of arable land flooded in the Arrow Lakes region 14 communities and about 2000 people displaced Several hundred more displaced by Lake Koocanusa behind Libby dam Were Arrow Lakes farming families adequately compensated for their losses? What is the value of agricultural land in an increasingly food insecure and water scarce world? Does food security require sustainable agricultural communities? Lake Koocanusa behind Libby Dam Columbia Basin Project Grand Coulee Banks Lake Roosevelt Lake Quincy Basin Potholes Reservoir • • • • • • Implemented in 1952 Irrigates 671,000 acres 2000 miles of canals Distributes about 3 million acre-feet of water annually Benefits from storage from Canadian dams Has generated entirely new groundwater effects – water mounds Source: US Bureau of Reclamation John W. Keys III Pump-Generating Plant Main Canal flowing south to Quincy Basin Provincial Agricultural Land Commission Study 1994 by Wendy Holm Evaluation of the Effect of downstream benefits to Washington State Agriculture Under the Columbia Treaty on the Competitive Positioning of B.C. Producers. “The Facts” • In 1962 the Columbia Basin Project was supplying irrigation water to 452,756 acres of land. • By 1972 the total had increased to 517,400 acres • By 1992 the total had increased to 577,000 acres • Today the total is 671,000 acres. But Holm’s argument is NOT about an increase in irrigated acreage due to Canadian storage It is about LATE SUMMER irrigation capacity “The Facts” • Prior to construction of the CRT dams, the Banks Lake system could not provide reliable late summer irrigation water to the Columbia Basin Project area. • Late summer flows in the Columbia can be as low as 1/5 of the average flow for the year. • According to Holm’s calculations, the Canadian contribution to late summer storage is sufficient to provide an additional 2 acre-feet of irrigation water to 532,000 acres, thus providing them with a SECURE late summer supply. • Once CBT dams were constructed, Washington State farmers began shifting to higher value crops: apples, alfalfa, asparagus, potatoes, wheat, onions, grapes, rather than multiple hay crops, barley, oats and sugar beets. Agricultural Development of the Columbia Basin Project Area, 1962-1992 • Area planted in apples increased from 484 to 27,433 acres. • Apple yield per acre increased by 204%. • Apple crop value increased from 1.3 to 150 million dollars. • Area planted in grapes increased from 45 to 13,909 acres. • Asparagus: from 628 to 35,941 acres. • Onions: from 1,249 to 29,614 acres. • The real market value of all crops harvested in the Columbia Basin Project area increased by 219.2% compared to a 39% increase in the rest of Washington State (calculated in constant 1992 CA$). The Cost of Water • Bureau of Reclamation provides hidden subsidies. • Farmers pay only 15 cents on every dollar spent on irrigation infrastructure and system maintenance. • They receive other subsidies for rural electrification and pumping costs. • US farmers receive an additional hidden subsidy by receiving CRT storage water at no cost to them. • Farmers pay Bureau of Reclamation an annual fee, not a charge per volume used The Quincy Mound Deep aquifer (basalt): 29,000 acre-feet Upper aquifer (overlying unconsolidated deposits): currently stores 3.5 million acre-feet (Banks Lake storage capacity is only 715,000 acre-feet) The Pasco Mound Deep Aquifer: 23,000 acre-feet Upper Aquifer: now stores 5 million acre-feet Sources: Tanaka et al. 1974; Washington State Department of Ecology Water added to Quincy mound from 1952 to 1968 Source: Tanaka et al. 1974 The first use of irrigation water… West Canal Source: US Bureau of Reclamation Second use of the same water (private well in the Quincy Mound area) Washington State Department of Ecology issues permits to individual applicants for groundwater use. Water users must sign a contract with the Bureau of Reclamation, the owner of the water. “An economic analysis was conducted for the 15 new permits Ecology issued in spring 2010 for the Quincy Basin. It was calculated that these permits will increase land values by $83M, income from farm production by $24.22M, and add over 1000 jobs to the local economy. Source: Washington State Department of Ecology. 508-14 WAC Rule-Making. http://www.ecy.wa.gov/programs/wr/cwp/50814Rule.html. Volume of mound water licensed in the Quincy Basin • 177,000 acre-feet total annual withdrawal • (out of a total of 3.5 million acre-feet) • Total volume of water delivered to the Quincy Basin from Banks Lake? about 1 million acre-feet • Mound water thus currently allows for the re-use of about 15% of the total volume of CBP irrigation water Potential third use of the same water Photo by author: looking south from Frenchmen Hills Royal Slope and Pasco Basin Source: Adapted from Google Maps After third use in the Royal slope the water will drain back into the Columbia River via Lower Crab Creek West Canal Columbia River Lower Crab Creek (waste way) Lower Crab Creek, Royal Slope Photo by author: looking east with Saddle Mountains on the right Alternative third use of water…. Potholes Canal Four or five uses are possible... Othello Potholes Canal Scooteney Reservoir Mesa Pasco Mound Final use of the water (private well in Pasco mound area) By scaling the analysis done for the 15 Quincy permits to the 117 pending applications for the 508-14 area, a rough approximation of the economic returns can be made: • An $178.4M increase in agricultural land value • An $468M increase in commercial land value • An $189M annual increase from increased agricultural production and cycling the money through the economy • 2122 new jobs from development of agricultural systems and cycling the money through the economy • 6014 new jobs from commercial development and cycling the money through the economy 508-14 WAC Rule-Making. Department of Ecology. http://www.ecy.wa.gov/programs/wr/cwp/50814Rule.html Ecological effects of water mounds? Photo by author: looking south from near the Potholes reservoir How to Integrate Agriculture in a Comprehensive Basin-wide Governance • Broaden the scope of the Columbia River Treaty to include ecosystem functions, fisheries, agriculture, tourism, recreational hunting and fishing… • Or, create a new comprehensive agreement in which the treaty becomes one of several cross-border side agreements. • At a minimum, provide for an equitable distribution of agricultural benefits in British Columbia and Washington. • Agriculture is too big a player to leave out…


