Performance & Monitoring
advertisement
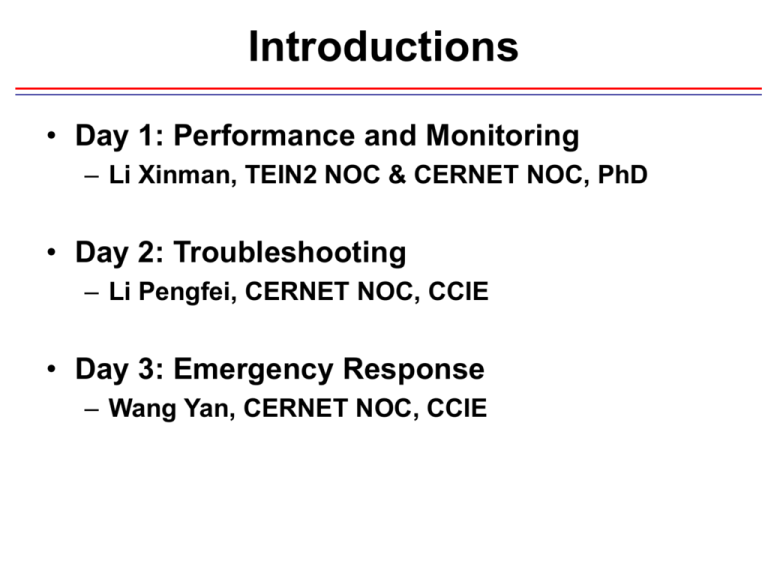
Introductions
• Day 1: Performance and Monitoring
– Li Xinman, TEIN2 NOC & CERNET NOC, PhD
• Day 2: Troubleshooting
– Li Pengfei, CERNET NOC, CCIE
• Day 3: Emergency Response
– Wang Yan, CERNET NOC, CCIE
Performance & Monitoring
Li Xinman
TEIN2 NOC, CERNET NOC
Sept.4-8, 2006
AIT, Thailand
Agenda
• Introduction to Performance Management
• TEIN2 NOC updates and NMS
• Performance Monitoring technologies and
tools
• Netflow and applications
• Case Study
Functions of Network Management
• Fault management
– Network state monitoring
– Failure logging, reporting and tracking etc.
• Configuration management
– device and software configuration
– version control (compare, apply and rollback, backup) etc.
• Accounting management
– billing and traffic measurement etc.
• Performance management
• Security Management
– Access control, worm/attack detection and alert etc.
Performance Management-Why
• Why needed and important?
– Capacity planning
• when do we need to upgrade our link and device?
–
–
–
–
–
Ensure network availability
Verify network performance, verify QoS (we expected)
Ensure SLA compliance (customer expected)
Better understanding and control of network
Optimization, make the network runs better!
• Murphy’s Law (also why need NOC?)
– If Anything can go wrong, it will.
– left to themselves, things tend to go from bad to worse.
(The network can’t look after itself. That’s nice for us )
• Proactive or reactive?
– Know problem before users and boss
– Solve the problem before their complain
Or
– Wait for problem to happen, and customers complain?
– As a NOC, we should be proactive, NOC means NO Complain!
Performance Management-What
• What’s performance management?
– understanding the behavior of a network and its
elements in response to traffic demands
– Measuring and reporting of network performance
to ensure that performance is maintained at a
acceptable level
Performance Management-How
• How to measure the network performance
– Delay, jitter, packet loss, bandwidth usage etc.
• The steps and process of performance management:
–
–
–
–
Data collection
Baseline the network
Determining the threshold for acceptable performance
Tunning
• Technologies and tools needed
– Data collection technologies such as: sniffing & netflow
– QoS
– Tools: ping, mrtg, iperf, wget, etc.
Delay (Latency)
• Delay = propagation delay + serialization delay
• Propagation delay: the time it takes to the physical
signal to traverse the path; depends on distance.
(add 6 ms for 1000km Fibre link)
– The delay from Beijing to Guanzhou is about 34 ms
(CERNET), the distance is about 3000Km.
• Serialization delay is the time it takes to actually
transmit the packet; caused by intermediate
networking devices, includes queuing, processing
and switching time (normally, less than 1ms for one
networking devices, but not firewalls or heavily
loaded routers)
• Comfortable human-to-human audio is only possible
for round-trip delays not greater than 100ms
• Tools: ping, traceroute etc.
Jitter
• is the variation of the delay, a.k.a the 'latency variance,' can
happen because:
– variable queue length generates variable latencies
– Load balancing with unequal latency
• In general, higher levels of jitter are more likely to occur on
either slow or heavily congested links. It is expected that the
increasing use of “QoS” control mechanisms such as class
based queuing, bandwidth reservation and of higher speed
links such as 100M Ethernet
• Harmless for many applications but real-time applications as
voice and video
• Applications will need jitter buffer to make it smoothly
• Tolerable Jitter range for VOIP is: 20ms – 30ms
• Tools: ping etc.
J1 = abs(t2-t1), J2=abs(t3-t2), ….
Packet Loss
• Loss of one or more packets, can happen because ...
– Link or hardware caused CRC error
– Link is congested or queue is full (tail drop or even
RED/WRED)
– route change (temporary drop) or blackhole route
(persistent drop)
– Interface or router down
– Misconfigured access-list
– ...
• 1% packet loss is terrible and unusable!
• Tools: ping etc.
Bandwidth Utilization
• Capacity plan: decide when to upgrade the link, but
maybe investment depended
• Better less than 35% (and commercial ISPs do)
• For CERNET, most links are above 70%, some above
95%, in our theory, for E&R networks, 70% is
acceptable
• For TEIN2 now, most links are below 15% !!
• Tools: MRTG, SNMP tools, telnet etc.
Network Availability
•
•
•
•
•
is the metric used to determine uptime and downtime
Availability = (uptime)/(total time) = 1-(downtime)/(total time)
Network availability is the IP layer reachability
Better > 99.9%
99.9%
– 30x24x60x0.1%=43.3 (Minutes), means the down time should be less
than 45 minutes in one month
• 99.99%
– 30x24x60x0.01%=4.3 (Minutes), means the down time should be less
than 5 minutes in one month!
• 99.9% is acceptable for R&E networks (Even 99.0% is acceptable),
some commercial ISPs can reach 99.99%
• The network devices should be 99.999% available or as specified,
but it’s not the truth even the top venders
Packets Per Second (PPS)
• Important for performance: network
performance is highly affected by PPS, such
as delay or packet loss, because the
serialization delay will increase because of
the load of the intermediate routers
• PPS is a very important metric to detect
DOS/DDOS traffic
– E.g. normally, the pps of one GE link is about
100,000 (baseline), if raised to 200,000 pps
sharply, then it means DOS.
• Easy to get: show interface
CPU and Memory Utilization
• We focus on routers
• CPU utilization better less than 30%
• For global routing routers, at least 512M
memory is needed
QoS
• QoS: Quality Of Service
• QoS is technology to manage network
performance
• QoS is a set of performance measurements
– Delay, Jitter, packet loss, availability, bandwidth
utilization etc.
• IP QoS: QoS for IP service
QoS Architecture
• Best Effort
• IntServ
–
–
–
–
–
End to end, session state needed
RSVP
CPU and Memory intensive
Difficult to deploy
Not scalable
• DiffServ
– PHB: Per-Hop-Behavior, Not end-to-end
– Scalable
– Easy to deploy
• What is using now: DiffServ + IP, DiffServ + MPLS
• If network bandwidth is enough, there is no need for
QoS?
QoS Practice: Traffic Shaping (rate-limit)
• 40Mbps for all outbound traffic
interface FastEthernet2/0
rate-limit output 40000000 400000 400000 conform-action
transmit exceed-action drop
• 40Mbps for specific traffic through ACL
interface FastEthernet2/0
rate-limit output access-list 110 40000000 400000 400000
conform-action transmit exceed-action drop
access-list 110 deny tcp any any eq www
access-list 110 deny tcp any eq www any
Access-list 110 permit ip any any
QoS Practice: Modular QoS Command
1) Classify the traffic, definition of traffic
class-map match-any limit-campus
match access-group 170
2) Define the traffic policy
policy-map limit-30M
class limit-campus
police 30000000 30000 30000 conform-action transmit
3) Apply the traffic policy
interface GigabitEthernet5/2
service-policy input limit-34M
service-policy output limit-34M
Traffic classification example
SLA and QoS
• SLA: Service Level Agreement
• SLA is the agreement between service provider and
customer, SLA defines the quality of the service the
service provider delivered, such as delay, jitter,
packet loss etc.
• SLA is a very important part of the business contract,
and also can be used to distinguish the service level
of different ISPs
Business
Technology
SLA
QoS
SLA example: Level 3
Delay
Packet Loss
Availability
Jitter
Bandwidth
SLA example: Sprintlink
Delay
Packet
loss
Availability
Jitter
North America
55 ms
0.30%
99.90%
2 ms
Europe
44 ms
0.30%
99.90%
2 ms
Asia
105 ms
0.30%
99.90%
2 ms
South pacific
70 ms
0.30%
99.90%
2 ms
Continental US
(Peerless IP)
55ms
0.1%
n/a
2 ms
Measurement Technology
• We’ve known what metrics used to describe
network performance, but how to measure them?
• Technologies and tools
–
–
–
–
–
ping, traceroute, telnet and CLI commands etc.
SNMP
Netflow (Cisco), Sflow (Juniper), NetStream (Huawei)
IP SLA (Cisco)
Etc.
ping
• Normally used as a troubleshooting tool
• Uses ICMP Echo messages to determine:
– Whether a remote device is active (for trouble shooting)
– round trip time delay (RTT), but not one-way delay
– Packet loss
• Sometime we need to specify the source and length
of packet using extended ping in router or host
– Why using large packet when ping?
(to test the link quality and throughput.)
– Large packet ping is prohibited in Windows, but Linux is ok
Sample Ping
Freebsd>% ping 202.112.60.31
PING 202.112.60.31 (202.112.60.31) 56(84) bytes of data.
64 bytes from 202.112.60.31: icmp_seq=1 ttl=253 time=0.326 ms
……
64 bytes from 202.112.60.31: icmp_seq=6 ttl=253 time=0.288 ms
6 packets transmitted, 6 received, 0% packet loss, time 4996ms
rtt min/avg/max/mdev = 0.239/0.284/0.326/0.025 ms
router# ping
Protocol [ip]:
Target IP address: 202.112.60.31
Repeat count [5]:
Datagram size [100]: 3000
Timeout in seconds [2]:
Extended commands [n]:
Sweep range of sizes [n]:
Type escape sequence to abort.
Sending 5, 3000-byte ICMP Echos to 202.112.60.31, timeout is 2 seconds:
!!!!!
Success rate is 100 percent (5/5), round-trip min/avg/max = 1/1/4 ms
traceroute
• Can be used to measure the RTT delay, and also the
delay between the routers along the path
• Unix/linux traceroute uses UDP datagram with
different TTL to discover the route a packet take to
the destination, Microsoft Windows tracert uses
ICMP protocol, If Windows tracert appears to show
continuous timeouts, the router may be filtering
ICMP traffic – try a Unix/Linux traceroute
• After the Nachi worm, many ISPs filter ICMP traffic.
So ping can not work, but traceroute is ok
19ms
2ms
H1
15ms
router1
2ms
router2
router3
Sample Traceroute
Router# traceroute 202.112.60.37
Type escape sequence to abort.
Tracing the route to 202.112.60.37
1 202.112.53.169
2 202.112.36.250
3 202.112.36.254
4 202.112.53.202
0 msec
20 msec
28 msec
24 msec
0 msec 0 msec
20 msec 16 msec
28 msec 24 msec
*
24 msec
Visual Route
• Visualization of traceroute information
• http://www.visualroute.com
telnet and CLI commands
• Using telnet manually or scripts programmed with
Expect to telnet the network device then issue the
CLI commands is also a useful and basic monitoring
method to get performance data
• It’s necessary because some data can only be
accessed through CLI commands, and not
supported by SNMP etc. How about config file?
Show interface
• Bandwidth utilization information, PPS etc
• Examples
– show interface GigaEthernet2/24
GigabitEthernet2/24 is up, line protocol is up (connected)
Description: to-tein2-xing-20060119
13% and 5.5%
Internet address is 202.179.241.26/30
MTU 9216 bytes, BW 1000000 Kbit, DLY 10 usec,
reliability 255/255, txload 33/255, rxload 14/255
Input queue: 0/75/1/0 (size/max/drops/flushes); Total output drops: 0
Queueing strategy: fifo
Output queue: 0/40 (size/max)
5 minute input rate 55010000 bits/sec, 17367 packets/sec
5 minute output rate 133299000 bits/sec, 18476 packets/sec
L2 Switched: ucast: 235554 pkt, 32942922 bytes - mcast: 44728 pkt, 4631058 bytes
L3 in Switched: ucast: 7786262800 pkt, 2957731471301 bytes - mcast: 0 pkt, 0
bytes mcast
L3 out Switched: ucast: 8883546304 pkt, 7850287572491 bytes mcast: 0 pkt, 0
bytes
– ......
• It’s better not to change the bandwidth setting (even for ospf metric)
Show process cpu/mem
• Measure the usage of CPU and memory
• router1>sh proc cpu
CPU utilization for five seconds: 2%/0%; one minute: 5%; five minutes: 5%
PID Runtime(ms) Invoked
uSecs 5Sec 1Min 5Min TTY Process
1
8
91
87 0.00% 0.00% 0.00% 0 Chunk Manager
2
5876 4393609
1 0.00% 0.00% 0.00% 0 Load Meter
3
1400 200869
6 0.00% 0.00% 0.00% 0 BGP Open
4
0
1
0 0.00% 0.00% 0.00% 0 EE48 TCAM Carve
5 50811784 2895942
17545 0.00% 0.25% 0.22% 0 Check heaps
....
• Sometime, the CPU usage of the processes ‘IP input’
and ‘BGP Scanner’ will be very high
• Remember don’t run out the telnet session number!
Else you will be keep out of the router.
SNMP
• SNMP is a Internet standard management
framework that provides facilities for managing
and monitoring network resources on the
Internet
• Components of SNMP
– MIB: managed information base
– SNMP Agent: software runs on network device to
maintain MIB
– SNMP manager: application program contacts agent to
query or modify the MIB at agent
– SNMP Protocol: is the application layer protocol used
by SNMP agents and managers to send and receive
data, the data is encoded in BER
– SMI: Structure and Syntax of Management Information,
standard defines how to create a MIB
SNMP Architecture
MIBs
• A MIB specifies the managed objects
• MIB is a text file that describes managed objects
using the syntax of ASN.1 (Abstract Syntax Notation 1)
• ASN.1 is a formal language for describing data and its
properties
• In Linux, MIB files are in the directory
/usr/share/snmp/mibs
– Multiple MIB files
– RFC1213-MIB.txt, MIB-II (defined in RFC 1213) defines the
managed objects of TCP/IP networks
Managed Objects
• Each managed object is assigned an object identifier
(OID)
• The OID is specified in a MIB file.
• An OID can be represented as a sequence of integers
separated by decimal points or by a text string:
Example:
– 1.3.6.1.2.1.4.6.
(looks like IPv6 address? )
– iso.org.dod.internet.mgmt.mib-2.ip.ipForwDatagrams
• When a SNMP manager requests an object, it sends
the OID to the SNMP agent.
Organization of Managed Objects
• Managed objects are
organized in a tree-like
hierarchy and the OIDs
reflect the structure of the
hierarchy.
• Each OID represents a node
in the tree.
• The OID 1.3.6.1.2.1
(iso.org.dod.internet.mgmt.
mib-2) is at the top of the
hierarchy for all managed
objects of the MIB-II.
• Manufacturers of networking
equipment can add product
specific objects to the
hierarchy.
.
root
iso(1)
org (3)
dod (6)
internet (1)
directory (1)
mgmt (2)
experimental (3)
private (4)
mib-2 (1)
system (1)
at (3)
interface (2)
icmp (5)
ip (4)
ipForwDatagrams (6)
tcp (6)
udp (7)
egp (8)
snmp (11)
transmission (10)
Definition of Managed Object in a MIB
1.
OBJECT-TYPE
–
–
String that describes the
MIB object.
Object Identifier (OID)
Standard MIB Object:
sysUpTime OBJECT-TYPE
2. SYNTAX
SYNTAX Time-Ticks
– Defines what kind of info
ACCESS read-only
is stored in the MIB object
STATUS mandatory
3. ACCESS
DESCRIPTION
– READ-ONLY, READ-WRITE
“Time since the network
4. STATUS
–
5.
State of object in regards
the SNMP community
DESCRIPTION
–
Reason why the MIB
object exists
management portion of
the system was last reinitialised.”
::= {system 3}
IF-MIB (64-bit counters)
SNMP Protocol
• C/S based, Client Pull and Server Push
• Ports: UDP 161(snmp messages), UDP 162(trap messages)
• SNMP manager and an SNMP agent communicate using the SNMP
protocol
– Generally: Manager sends queries and agent responds
– Exception: Traps are initiated by agent.
SNMP Functions
1. Get-request. Requests the values of one or more
objects
2. Get-next-request. Requests the value of the next
object, according to a lexicographical ordering of
OIDs.
3. Set-request. A request to modify the value of one or
more objects
4. Get-response. Sent by SNMP agent in response to
a get-request, get-next-request, or set-request
message.
5. Trap. An SNMP trap is a notification sent by an
SNMP agent to an SNMP manager, which is
triggered by certain events at the agent
Traps
• Traps are triggered by an event
• Defined traps include:
–
–
–
–
–
–
linkDown: Even that an interface went down
coldStart - unexpected restart (i.e., system crash)
warmStart - soft reboot
linkUp - the opposite of linkDown
(SNMP) AuthenticationFailure
…
• Traps can be received by a management application,
and handled in several ways: logging, paging,
alerting, or completely ignore
SNMP Versions
• Three versions are in use today:
– SNMPv1 (1990)
– SNMPv2c (1996)
• Adds “GetBulk” function and some new data types (such as 64 bit counters)
• Adds RMON (remote monitoring) capability
• The only version endorsed by IETF but not others as SNMPv2u and SNMPv2*
with security features.
– SNMPv3 (2002)
• SNMPv3 started from SNMPv1 (and not SNMPv2c)
• Addresses security
• All versions are still used today, but version 1&2 are
most commonly used, don’t bother version 3 if not
necessary
• Many SNMP agents and managers support all three
versions of the protocol
SNMP Community Strings
• Like passwords
• Two kinds:
- READ-ONLY: You can send out a Get & GetNext to the SNMP
agent, and if the agent is using the same read-only string it
will process the request.
- READ-WRITE: Get, GetNext, and Set. If a MIB object has an
ACCESS value of read-write, then a Set PDU can change the
value of that object with the correct read-write community
string.
• Default community string: public (read), private
(write)
• Keep the R/W community string secret ! In the fact,
RW comnunity is not so necessary!
SNMP Security
• SNMPv1 uses plain text community strings for
authentication as plain text without encryption
• SNMPv2 was supposed to fix security problems, but
effort de-railed (The “c” in SNMPv2c stands for
“community”).
• SNMPv3 has numerous security features: Integrity,
authentication and privacy
– Instead of granting access rights to a community, SNMPv3
grants access to users
– Access can be restricted to sections of the MIB (View based
Access Control Module (VACM). Access rights can be
limited
• by specifying a range of valid IP addresses for a user or
community,
• or by specifying the part of the MIB tree that can be accessed
SNMP Configuration
• Configuring SNMP access
snmp-server community notpublic ro
snmp-server community topsecret rw 60
access-list 60 permit 10.1.1.1
access-list 60 permit 10.2.2.2
• Configuring Traps
snmp-server host 10.1.1.1 public
snmp-server enable traps
snmp-server enable traps bgp
snmp-server enable traps snmp bgp
snmp-server trap-source loopback 0
• About View (for security)
Snmp-server view testview 1.3.6.1.2.1 included
Snmp-server view testview 1.3.6.1.4.1.9 included
Snmp-server community test1 testview ro 60
(mib-2)
(cisco)
ifIndex – Interface Name?
• Ifindex is the unique value to identify interface of a
router
• show snmp mib ifmib ifindex interface
– to show the ifindex of interfaces, e.g.
(router)#sh snmp mib ifmib ifindex pos9/0
Interface = POS9/0, Ifindex = 28
– Or snmpwalk?
• Most management software using ifIndex for data
collection and monitoring, such as MRTG, for SNMP,
it’s a part of an OID
• But it will change after router reboot
• snmp-server ifindex persist
– Keep from changing when reboot
System MIB (MIB-II)
.1.3.6.1.2.1.1.1
.ios.org.dod.internet.mgmt.mib-2.system
.1.3.6.1.2.1.1.1.1
.ios.org.dod.internet.mgmt.mib-2.system.sysDescr
.1.3.6.1.2.1.1.1.2
.ios.org.dod.internet.mgmt.mib-2.system.sysObjectID
.1.3.6.1.2.1.1.1.3
.ios.org.dod.internet.mgmt.mib-2.system.sysUpTime
.1.3.6.1.2.1.1.1.4
.ios.org.dod.internet.mgmt.mib-2.system.sysContact
.1.3.6.1.2.1.1.1.5
.ios.org.dod.internet.mgmt.mib-2.system.sysName
MIB instances
• Each MIB can have an instance, some will have more
• A MIB for a router’s (entity) interface information:
iso(1) org(3) dod(6) internet(1) mgmt(2) mib-2(1) interfaces(2) ifTable(2) ifEntry(1)
• Require one ifEntry value per interface (e.g. 3)
• One MIB object definition can represent multiple
instances through Tables, Entries, and Indexes
ENTRY + INDEX = INSTANCE
ifType(3)
ifMtu(4)
Index #1
ifType.1[6]
ifMtu.1
Index #2
ifType.2:[9]
ifMtu.2
Index #3
ifType.3:[15]
ifMtu.3
Etc…
SNMP Operation: snmpget
•
Example 1:
–
–
•
MIB:
1.3.6.1.2.1.1.1.1
ios.org.dod.internet.mgmt.mib-2.system.sysDescr
Results:
$ snmpget -v 1 202.112.0.156 test888 .1.3.6.1.2.1.1.1.0
system.sysDescr.0 = Cisco Internetwork Operating System Software
IOS (tm) C2600 Software (C2600-I-M), Version 12.2(11)T3, RELEASE SOFTWARE (fc2)
TAC Support: http://www.cisco.com/tac
Copyright (c) 1986-2002 by cisco Systems, Inc.
Compiled Sun 22-Dec-02 02:49 by ccai
Exmple 2:
–
–
MIB:
1.3.6.1.2.1.1.1.3
ios.org.dod.internet.mgmt.mib-2.system.sysUpTime
Results:
$ snmpget -v 2c 202.112.0.156 test888 .1.3.6.1.2.1.1.3.0
system.sysUpTime.0 = Timeticks: (494755800) 57 days, 6:19:18.00
SNMP Operation: snmpset
•
MIB
1.3.6.1.2.1.1.1.4
ios.org.dod.internet.mgmt.mib-2.system.sysContact
•
Operation
$ snmpget -v 1 202.112.0.xxx write888 .1.3.6.1.2.1.1.4.0
system.sysContact.0 = test
$ snmpset -v 1 202.112.0.xxx write888 .1.3.6.1.2.1.1.4.0 s
"CERNET NOC"
system.sysContact.0 = CERNET NOC
$ snmpget -v 1 202.112.0.xxx write888 .1.3.6.1.2.1.1.4.0
system.sysContact.0 = CERNET NOC
SNMP Operation: snmpwalk
•
MIB
1.3.6.1.2.1.1.1
ios.org.dod.internet.mgmt.mib-2.system
•
Operation
$ snmpwalk -v 2c 202.112.0.xxx test888 .1.3.6.1.2.1.1
system.sysDescr.0 = Cisco Internetwork Operating System Software
IOS (tm) C2600 Software (C2600-I-M), Version 12.2(11)T3, RELEASE
SOFTWARE (fc2)
TAC Support: http://www.cisco.com/tac
Copyright (c) 1986-2002 by cisco Systems, Inc.
Compiled Sun 22-Dec-02 02:49 by ccai
system.sysObjectID.0 = OID: enterprises.9.1.208
system.sysUpTime.0 = Timeticks: (494811433) 57 days, 6:28:34.33
system.sysContact.0 = "CERNET NOC, 86-10-62784048"
system.sysName.0 = cernoclab
system.sysLocation.0 = "THU Main Building Room306"
system.sysServices.0 = 78
system.sysORLastChange.0 = Timeticks: (0) 0:00:00.00
SNMP Operation: snmpbulkget
•
MIB
1.3.6.1.2.1.1.1
ios.org.dod.internet.mgmt.mib-2.system
•
Operation
$ snmpbulkget -v 2c -B 0 10 202.112.0.xxx test888 .1.3.6.1.2.1.1
system.sysDescr.0 = Cisco Internetwork Operating System Software
IOS (tm) C2600 Software (C2600-I-M), Version 12.2(11)T3, RELEASE
SOFTWARE (fc2)
TAC Support: http://www.cisco.com/tac
Copyright (c) 1986-2002 by cisco Systems, Inc.
Compiled Sun 22-Dec-02 02:49 by ccai
system.sysObjectID.0 = OID: enterprises.9.1.208
system.sysUpTime.0 = Timeticks: (494914259) 57 days, 6:45:42.59
system.sysContact.0 = CERNET NOC
system.sysName.0 = cernoclab
system.sysLocation.0 = "THU Main Building Room306"
system.sysServices.0 = 78
system.sysORLastChange.0 = Timeticks: (0) 0:00:00.00
interfaces.ifNumber.0 = 3
interfaces.ifTable.ifEntry.ifIndex.1 = 1
Interface MIB (MIB-II, 32bit counters)
1.3.6.1.2.1.2
ios.org.dod.internet.mgmt.mib-2.interfaces
1.3.6.1.2.1.2.1
.ifNumber
1.3.6.1.2.1.2.2
.ifTable
1.3.6.1.2.1.2.2.1
.ifTable.ifEntry
1.3.6.1.2.1.2.2.1.2
.ifTable.ifEntry.ifDescr
1.3.6.1.2.1.2.2.1.10
.ifTable.ifEntry.ifInOctets
1.3.6.1.2.1.2.2.1.16
.ifTable.ifEntry.ifOutOctets
Interface MIB (MIB-II) Operation
$ snmpget -v 2c 202.112.0.xxx test888 .1.3.6.1.2.1.2.2.1.2.1
interfaces.ifTable.ifEntry.ifDescr.1 = FastEthernet0/0
$ snmpget -v 2c 202.112.0.xxx test888 .1.3.6.1.2.1.2.2.1.10.1
interfaces.ifTable.ifEntry.ifInOctets.1 = Counter32: 2984051368
$ snmpget -v 2c 202.112.0.xxx test888 .1.3.6.1.2.1.2.2.1.16.1
interfaces.ifTable.ifEntry.ifOutOctets.1 = Counter32: 490955885
Cisco Interface MIB
.1.3.6.1.4.1.9.2.2.1.1
.iso.org.dod.internet.private.enterprises.cisco.local.interfaces.lifTa
ble.lifEntry
.1.3.6.1.4.1.9.2.2.1.1.1
.locIfHardType
.1.3.6.1.4.1.9.2.2.1.1.28
.locIfDescr
.1.3.6.1.4.1.9.2.2.1.1.6
.locIfInBitsSec
.1.3.6.1.4.1.9.2.2.1.1.7
.locIfInBitsPktsSec
.1.3.6.1.4.1.9.2.2.1.1.8
.locIfOutBitsSec
.1.3.6.1.4.1.9.2.2.1.1.9
.locIfOutpktsSec
Cisco Interface MIB Operation
• Operation
$ snmpget -v 2c 202.112.xx.xx public .1.3.6.1.4.1.9.2.2.1.1.28.159
enterprises.9.2.2.1.1.28.159 = "bj-a1 to bj1 10G"
$ snmpget -v 2c 202.112.xx.xx public .1.3.6.1.4.1.9.2.2.1.1.1.159
enterprises.9.2.2.1.1.1.159 = "C6k 10000Mb 802.3"
$ snmpget -v 2c 202.112.xx.xx public .1.3.6.1.4.1.9.2.2.1.1.6.159
enterprises.9.2.2.1.1.6.159 = 1179992000
$ snmpget -v 2c 202.112.xx.xx public .1.3.6.1.4.1.9.2.2.1.1.8.159
enterprises.9.2.2.1.1.8.159 = 1835180000
• Show interface
bj-a1-bgw#sh int te7/3
TenGigabitEthernet7/3 is up, line protocol is up (connected)
Hardware is C6k 10000Mb 802.3, address is 0014.a9f7.be80 (bia
0014.a9f7.be80)
Description: bj-a1 to bj1 10G
5 minute input rate 1177610000 bits/sec, 327712 packets/sec
5 minute output rate 1835759000 bits/sec, 358057 packets/sec
RMON
• Remote Monitoring Specification: provides standard
information that a network administrator can use to
monitor, analyze, and troubleshoot a group of
distributed local area networks (LANs) and
interconnecting lines from a central site
• RMON is for traffic management
• specified as part of the MIB and an extension of
SNMP
• the latest level is RMON Version 2 (referred to as
"RMON 2" or "RMON2")
• RMON can be supported by hardware monitoring
devices (known as "probes") or through software or
some combination
Diagram of RMON MIB
Root
ISO
Mgmt
MIB 1&2
MIB 1
RMON
Org
DoD
Internet
Private
RMON1
1. Statistics
2. History
3. Alarm
11. Protocol Directory
12. Protocol Distribution
13. Address Map
4. Hosts
14. Network-Layer Host
5. Host Top N
6. Matrix
MIB 2
RMON2
7. Filter
8. Capture
9. Event
10. Token Ring
15. Network-Layer Matrix
16. Application-Layer Host
17. Application-Layer Matrix
18. User History
19. Probe Configuration
20. RMON Conformance
RMON MIB Groups
Statistics - Traffic and error rates on a segment
History - Above statistics with a time stamp
Alarm - User defined threshold alarms on any RMON variable
Hosts - Traffic and error rates for each host by MAC address
Host Top N - Sorts hosts by top traffic and/or error rates
Matrix - Conversation matrix between hosts
Filter - Definition of what packet types to capture and store
Packet Capture - Creates a capture buffer on the probe that
can be requested and decoded by the management application
Event - Generates log entries and/or SNMP traps
Token Ring - Token Ring extensions, most complex group
RMON2
RMON2 is standard for monitoring higher protocol layers.
Application
Presentation
Session
Transport
RMON2
Network
Data Link
Physical
RMON
SNMP Tools
• CLI Commands
– Snmpget, snmpset, snmpwalk, snmpbulk, etc
• MIB Browser
– iReasoning, solarwinds etc
• Large Applications: Network Management
System
–
–
–
–
HP OpenView
IBM Tivoli (netview)
Sun NetManager
Etc.
Commercial SNMP Applications
•http://www.hp.com/go/openview/
HP OpenView
•http://www.tivoli.com/
IBM NetView
•http://www.novell.com/products/managewise/
Novell ManageWise
•http://www.sun.com/solstice/
Sun MicroSystems Solstice
•http://www.microsoft.com/smsmgmt/
Microsoft SMS Server
•http://www.compaq.com/products/servers/management/
Compaq Insight Manger
•http://www.redpt.com/
SnmpQL - ODBC Compliant
•http://www.empiretech.com/
Empire Technologies
•ftp://ftp.cinco.com/users/cinco/demo/
Cinco Networks NetXray
•http://www.netinst.com/html/snmp.html
SNMP Collector (Win9X/NT)
•http://www.netinst.com/html/Observer.html
Observer
•http://www.gordian.com/products_technologies/snmp.html
Gordian’s SNMP Agent
•http://www.castlerock.com/
Castle Rock Computing
•http://www.adventnet.com/
Advent Network Management
•http://www.smplsft.com/
SimpleAgent, SimpleTester
SNMP Tools-GUI (MIB Browser)
MRTG
• The Multi Router Traffic Grapher: a freeware
written in Perl, works on unix/linux, graph
data collected from routers and other
devices or applications based on SNMP.
• One of most popular network monitoring
tools used today: to monitoring the
bandwidth utilization of network link
• SNMP v2c support, no more counter
wrapping
• http://oss.oetiker.ch/mrtg/
Configuration of MRTG
• cfgmaker to generate a configuration file and tune
cfgmaker public@192.168.1.1 | tee test.cfg
• Setting up crontab in (/etc/crontab), runs every 5 minutes
*/5 * * * * wang /usr/bin/mrtg /home/wang/mrtg/test1.cfg
• Two basic object types in MRTG
– Counter: object that returns an unsigned integer that grows
over time
– Gauge: A gauge integer will go up an down according the
variable it tracks
Options[_]: gauge, growright
• Enable snmpv2c:
Target[192.168.1.12_28]: 28:test888@192.168.1.12:
Target[192.168.1.12_28]: 28:test888@192.168.1.12:::::2
Version 1 (default)
Version 2c
MRTG Example
Bandwidth Utilization Monitoring
Delay & Packet Loss
IPerf
• Client/server application that
–Measures maximum TCP performance
–Facilitates tuning of TCP and UDP parameters
–Reports bandwidth, jitter, and packet loss
• http://dast.nlanr.net/Projects/Iperf/
Performance Management Process
Performance
management
Detection
Baseline
Optimization
Monitoring
Performance Matrix
•
•
•
•
Traffix Matrix
Delay Matrix
Packet Loss Matrix
…….
Distributed Backbone Performance
Monitoring Architecture
Management
Console
……
Performance data collection agents in infrastructure
Data Collection Agent
• Routers?
– Embedded: If the router is strong enough, it’s ok
– Dedicated routers: Shadow Router
• Cisco 26xx/28xx is enough
• Steady and easy to deploy
• Mature software solutions
• Servers?
– Embedded: If the load of the server is not heavy, it’s good
– Dedicated Servers: Test Server
• Flexible: monitoring anything as you like
• Easy: Free tools is quite enough
– Ping, traceroute, iperf, wget, beacon etc.
• Low Cost: a normal 1U PC server is not as expensive as a
router
Cisco Performance Measure
Technology
Introduction of IP SLA
• Allow users to monitor network performance
between Cisco routers or from either a Cisco
router to a remote IP device.
• Embedded within Cisco IOS software and
there is no additional device to deploy, learn,
or manage.
• A dependable, a scalable, cost-effective
solution for network performance
measurement.
• Collect network performance information in
real time: response time, one-way latency,
jitter, packet loss, voice quality measurement,
and other network statistics.
Multi-Protocol Measurement and
Management with Cisco IOS IP SLAs
CERNET: Data Collection Agents Distribution
National Center
Access
Console
Server
Agent
Core
PoP
PoP
Core
PoP
Core
Core
Access
Access
Access
Agent
……
Agent
Agent
Tools and Technologies Used
•
•
•
•
•
•
•
•
•
•
Ping
Traceroute
Snmp
telnet
FreeBSD
Perl
Rrdtools, GD
Multicast beacon
Iperf
Etc.
Performance Metric Example: Packet Loss
Performance Metric Example: Delay
Performance Metric Example: Multicast
Thank You!
• Some materials are from network, thanks
goes to the authors!
