Data Interpretation Test 5
Time Left: 00:29:56
Data Interpretation
Note:
Direction (for Q.Nos. 1 - 5):
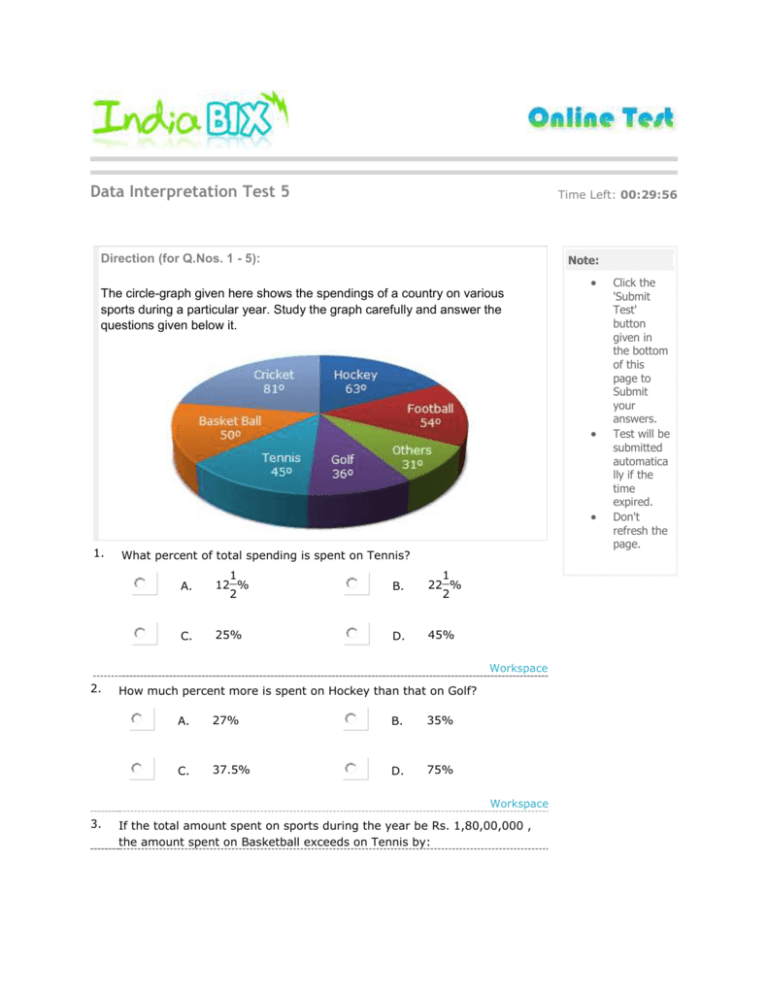
The circle-graph given here shows the spendings of a country on various
sports during a particular year. Study the graph carefully and answer the
questions given below it.
1.
What percent of total spending is spent on Tennis?
A.
1
12 %
2
B.
1
22 %
2
C.
25%
D.
45%
Workspace
2.
How much percent more is spent on Hockey than that on Golf?
A.
27%
B.
35%
C.
37.5%
D.
75%
Workspace
3.
If the total amount spent on sports during the year be Rs. 1,80,00,000 ,
the amount spent on Basketball exceeds on Tennis by:
Click the
'Submit
Test'
button
given in
the bottom
of this
page to
Submit
your
answers.
Test will be
submitted
automatica
lly if the
time
expired.
Don't
refresh the
page.
A.
Rs. 2,50,000
B.
Rs. 3,60,000
C.
Rs. 3,75,000
D.
Rs. 4,10,000
Workspace
4.
How much percent less is spent on Football than that on Cricket?
A.
2
22 %
9
B.
27%
C.
1
33 %
3
D.
1
37 %
7
Workspace
5.
If the total amount spent on sports during the year was Rs. 2 crores, the
amount spent on Cricket and Hockey together was:
A.
Rs. 8,00,000
B.
Rs. 80,00,000
C.
Rs. 1,20,00,000
D.
Rs. 1,60,00,000
Workspace
Direction (for Q.Nos. 6 - 10):
Answer the questions based on the given line graph.
Ratio of Exports to Imports (in terms of money in Rs. crores) of Two
Companies Over the Years
6. In how many of the given years were the exports more than the imports for
Company A?
A.
2
B.
3
C.
4
D.
5
Workspace
7.
If the imports of Company A in 1997 were increased by 40 percent, what
would be the ratio of exports to the increased imports?
A.
1.20
B.
1.25
C.
1.30
D.
cannot be
determined
Workspace
8.
If the exports of Company A in 1998 were Rs. 237 crores, what was the
amount of imports in that year?
A.
Rs. 189.6 crores
B.
Rs. 243 crores
C.
Rs. 281 crores
D.
Rs. 316 crores
Workspace
9.
In 1995, the export of Company A was double that of Company B. If the
imports of Company A during the year was Rs. 180 crores, what was the
approximate amount of imports pf Company B during that year?
A.
Rs. 190 crores
B.
Rs. 210 crores
C.
Rs. 225 crores
D.
Cannot be
determined
Workspace
10. In which year(s) was the difference between impors and exports of
Company B the maximum?
A.
2000
B.
1996
C.
1998 and 2000
D.
Cannot be
determined
Workspace
Direction (for Q.Nos. 11 - 15):
The following table shows the number of new employees added to different
categories of employees in a company and also the number of employees
from these categories who left the company every year since the foundation of
the Company in 1995.
Year Managers Technicians Operators Accountants
New Left
New
Left
New Left
New
Left
Peons
New Left
1995
760
-
1200
-
880
-
1160
-
820
-
1996
280
120
272
120
256
104
200
100
184
96
1997
179
92
240
128
240
120
224
104
152
88
1998
148
88
236
96
208
100
248
96
196
80
1999
160
72
256
100
192
112
272
88
224
120
2000
193
96
288
112
248
144
260
92
200
104
11. What is the difference between the total number of Technicians added to
the Company and the total number of Accountants added to the Company
during the years 1996 to 2000?
A.
128
B.
112
C.
96
D.
88
Workspace
12. What was the total number of Peons working in the Company in the year
1999?
A.
1312
B.
1192
C.
1088
D.
968
Workspace
13. For which of the following categories the percentage increase in the
number of employees working in the Company from 1995 to 2000 was the
maximum?
A.
Managers
B.
Technicians
C.
Operators
D.
Accountants
Workspace
14. What is the pooled average of the total number of employees of all
categories in the year 1997?
A.
1325
B.
1195
C.
1265
D.
1235
Workspace
15. During the period between 1995 and 2000, the total number of Operators
who left the Company is what percent of total number of Operators who
joined the Company?
A.
19%
B.
21%
C.
27%
D.
29%
Workspace
Direction (for Q.Nos. 16 - 20):
Study the following bar chart and answer the questions carefully.
Sales Turnover of 5 Companies (in Rs. crores)
16. What is the percentage change in the overall sales turnover of the five
companies together between 2001 - 2002 and 2002 - 2003 ?
A.
17.21 %
B.
14.68 %
C.
12.67 %
D.
21.24 %
Workspace
17. What is the absolute change in overall sales turnover of the five companies
together between 2001 - 2002 and 2002 - 2003 ?
A.
712.43
B.
142.48
C.
683.53
D.
None of these
Workspace
18. Which of the companies shows the maximum percentage difference in
sales turnover between the two years ?
A.
Honda
B.
GM
C.
Hyundai
D.
Maruti
Workspace
19. What should have been the sales turnover of GM in 2002 - 2003 to have
shown an excess of the same quantum over 2001 - 2002 as shown by the
sales turnover of Maruti ?
A.
953.76
B.
963.76
C.
952.76
D.
962.76
Workspace
20. What is the approximate difference between the average sales turnover of
all the companies put together between the years 2001 - 2002 and 2002 2003 ?
A.
133.45
B.
142.48
C.
117.6
D.
None of these
Workspace
© 2008-2012 by IndiaBIX™ Technologies. All Rights Reserved | Copyright | Terms of Use & Privacy Policy
Contact us: info@indiabix.com
Bookmark to:
Follow us on twitter!


