Two varieties of Tropicana orange juice were obtained: Regular and
advertisement
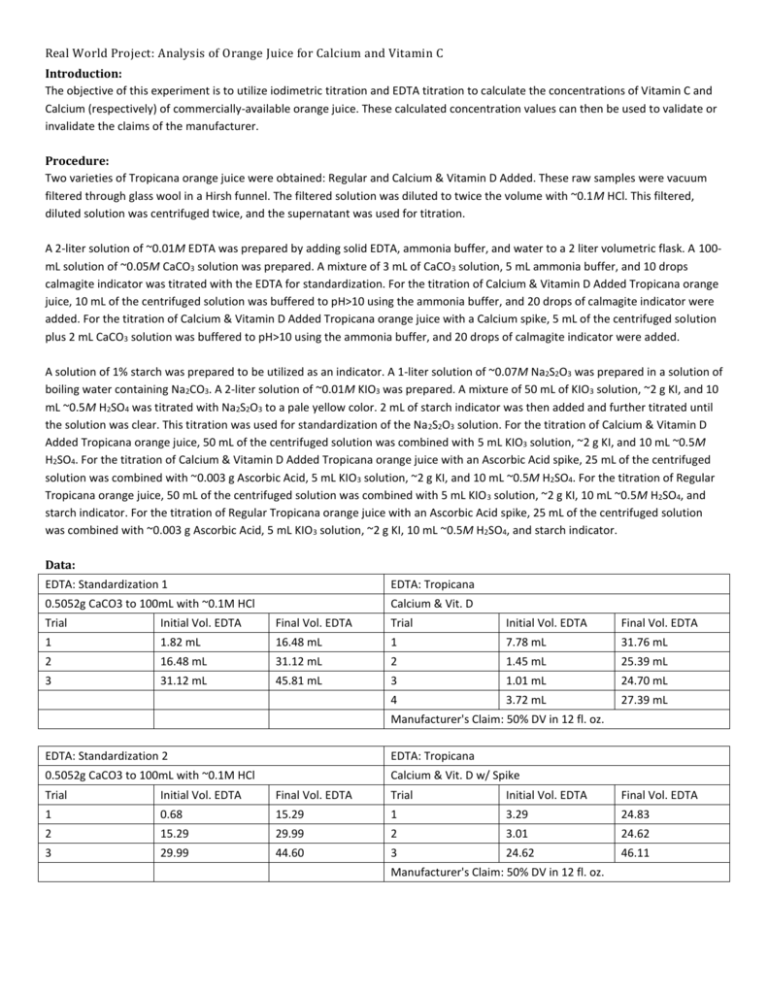
Real World Project: Analysis of Orange Juice for Calcium and Vitamin C Introduction: The objective of this experiment is to utilize iodimetric titration and EDTA titration to calculate the concentrations of Vitamin C and Calcium (respectively) of commercially-available orange juice. These calculated concentration values can then be used to validate or invalidate the claims of the manufacturer. Procedure: Two varieties of Tropicana orange juice were obtained: Regular and Calcium & Vitamin D Added. These raw samples were vacuum filtered through glass wool in a Hirsh funnel. The filtered solution was diluted to twice the volume with ~0.1M HCl. This filtered, diluted solution was centrifuged twice, and the supernatant was used for titration. A 2-liter solution of ~0.01M EDTA was prepared by adding solid EDTA, ammonia buffer, and water to a 2 liter volumetric flask. A 100mL solution of ~0.05M CaCO3 solution was prepared. A mixture of 3 mL of CaCO 3 solution, 5 mL ammonia buffer, and 10 drops calmagite indicator was titrated with the EDTA for standardization. For the titration of Calcium & Vitamin D Added Tropicana orange juice, 10 mL of the centrifuged solution was buffered to pH>10 using the ammonia buffer, and 20 drops of calmagite indicator were added. For the titration of Calcium & Vitamin D Added Tropicana orange juice with a Calcium spike, 5 mL of the centrifuged solution plus 2 mL CaCO3 solution was buffered to pH>10 using the ammonia buffer, and 20 drops of calmagite indicator were added. A solution of 1% starch was prepared to be utilized as an indicator. A 1-liter solution of ~0.07M Na2S2O3 was prepared in a solution of boiling water containing Na2CO3. A 2-liter solution of ~0.01M KIO3 was prepared. A mixture of 50 mL of KIO 3 solution, ~2 g KI, and 10 mL ~0.5M H2SO4 was titrated with Na2S2O3 to a pale yellow color. 2 mL of starch indicator was then added and further titrated until the solution was clear. This titration was used for standardization of the Na 2S2O3 solution. For the titration of Calcium & Vitamin D Added Tropicana orange juice, 50 mL of the centrifuged solution was combined with 5 mL KIO3 solution, ~2 g KI, and 10 mL ~0.5M H2SO4. For the titration of Calcium & Vitamin D Added Tropicana orange juice with an Ascorbic Acid spike, 25 mL of the centrifuged solution was combined with ~0.003 g Ascorbic Acid, 5 mL KIO3 solution, ~2 g KI, and 10 mL ~0.5M H2SO4. For the titration of Regular Tropicana orange juice, 50 mL of the centrifuged solution was combined with 5 mL KIO 3 solution, ~2 g KI, 10 mL ~0.5M H2SO4, and starch indicator. For the titration of Regular Tropicana orange juice with an Ascorbic Acid spike, 25 mL of the centrifuged solution was combined with ~0.003 g Ascorbic Acid, 5 mL KIO3 solution, ~2 g KI, 10 mL ~0.5M H2SO4, and starch indicator. Data: EDTA: Standardization 1 EDTA: Tropicana 0.5052g CaCO3 to 100mL with ~0.1M HCl Calcium & Vit. D Trial Initial Vol. EDTA Final Vol. EDTA Trial Initial Vol. EDTA Final Vol. EDTA 1 1.82 mL 16.48 mL 1 7.78 mL 31.76 mL 2 16.48 mL 31.12 mL 2 1.45 mL 25.39 mL 3 31.12 mL 45.81 mL 3 1.01 mL 24.70 mL 4 3.72 mL 27.39 mL Manufacturer's Claim: 50% DV in 12 fl. oz. EDTA: Standardization 2 EDTA: Tropicana 0.5052g CaCO3 to 100mL with ~0.1M HCl Calcium & Vit. D w/ Spike Trial Initial Vol. EDTA Final Vol. EDTA Trial Initial Vol. EDTA Final Vol. EDTA 1 0.68 15.29 1 3.29 24.83 2 15.29 29.99 2 3.01 24.62 3 29.99 44.60 3 24.62 46.11 Manufacturer's Claim: 50% DV in 12 fl. oz. Thiosulfate: Standardization 1 Thiosulfate: Tropicana 4.2888 g KIO3 diluted to 2 L with dH2O Initial Vol. Trial Mass KI Na2S2O3 1 2.0558 g 2.20 mL Calcium & Vit. D Final Vol. Na2S2O3 41.22 mL 2 2.0640 g 0.78 mL 3 2.0769 g 2.09 mL 2.0323 g Initial Vol. Na2S2O3 19.35 mL Final Vol. Na2S2O3 22.93 mL 2 2.0428 g 22.93 mL 26.49 mL 3 2.0313 g 26.58 mL 30.03 mL Trial Mass KI 1 39.88 mL 41.10 mL Manufacturer’s Claim: 150% DV in 12 fl. oz. Thiosulfate: Standardization 2 Thiosulfate: Tropicana 4.2888 g KIO3 diluted to 2 L with dH2O Initial Vol. Trial Mass KI Na2S2O3 1 2.0458 g 3.10 mL Calcium & Vit. D w/ Spike Final Vol. Na2S2O3 41.31 mL 2 2.0240 g 2.13 mL 3 2.0119 g 2.09 mL 0.0037 g Initial Vol. Na2S2O3 10.88 mL Final Vol. Na2S2O3 14.32 mL 2.0299 g 0.0039 g 14.32 mL 17.71 mL 2.0446 g 0.0035 g 17.71 mL 21.10 mL Initial Vol. Na2S2O3 Final Vol. Na2S2O3 Trial Mass KI Mass AA 1 2.0296 g 40.69 mL 2 40.72 mL 3 Manufacturer’s Claim: 150% DV in 12 fl. oz. Thiosulfate: Tropicana Thiosulfate: Tropicana Regular Regular w/ Spike Trial Initial Vol. Na2S2O3 Mass KI 1 2.0180 g 7.63 mL Final Vol. Na2S2O3 Trial Mass KI Mass AA 10.81 mL 1 2.0181 g 0.0037 g 17.91 mL 21.14 mL 2.0530 g 0.0041 g 21.14 mL 24.31 mL 2.0437 g 0.0037 g Manufacturer’s Claim: 150% DV in 12 fl. oz. 24.31 mL 27.51 mL 2 2.0414 g 11.32 mL 14.53 mL 2 3 2.0288 g 14.60 mL 17.88 mL 3 Formulas for Calculations: Change in Volume Equation Change in Volume Example Δ𝑉 = 𝑉𝑓 − 𝑉𝑖 Molarity of CaCO3 Equation 𝑀𝐶𝑎𝐶𝑂3 = 𝑔𝐶𝑎𝐶𝑂3 × Molarity of CaCO3 Example 1𝑚𝑜𝑙 ÷ 0.100𝐿𝑠𝑜𝑙𝑛 100.0869𝑔 Molarity of EDTA Equation 𝐿𝐶𝑎𝐶𝑂3 ∗ 𝑀𝐶𝑎𝐶𝑂3 𝐿𝐸𝐷𝑇𝐴 (because moles of EDTA = moles of Ca2+ = moles of CaCO3) Claimed g Ca2+/AA in Orange Juice Equation 0.500𝑔𝐶𝑎2+ 1𝑓𝑙. 𝑜𝑧. 5 𝑚𝐿 𝑝𝑢𝑟𝑒 × × 12 𝑓𝑙. 𝑜𝑧. 29.5735 𝑚𝐿 𝑠𝑎𝑚𝑝𝑙𝑒 Grams Ca2+ in Orange Juice Equation ̅𝐸𝐷𝑇𝐴 × 𝑔𝐶𝑎2+ = 𝐿𝐸𝐷𝑇𝐴 × 𝑀 1𝑚𝑜𝑙𝐶𝑎2+ 40.078𝑔𝐶𝑎2+ × 1𝑚𝑜𝑙𝐸𝐷𝑇𝐴 1𝑚𝑜𝑙𝐶𝑎2+ Molarity of KIO3 Equation 𝑀𝐾𝐼𝑂3 = 𝑔𝐾𝐼𝑂3 × 0.05048𝑀𝐶𝑎𝐶𝑂3 = 0.5052𝑔𝐾𝐼𝑂3 × 1𝑚𝑜𝑙 ÷ 0.100𝐿𝑠𝑜𝑙𝑛 100.0869𝑔 Molarity of EDTA Example 𝑀𝐸𝐷𝑇𝐴 = 𝑔𝐶𝑎2+ = 14.66mL = 16.48𝑚𝐿 − 1.82𝑚𝐿 0.01033𝑀𝐸𝐷𝑇𝐴 = 0.00300𝐿𝐶𝑎𝐶𝑂3 ∗ 0.05048𝑀𝐶𝑎𝐶𝑂3 0.01466𝐿𝐸𝐷𝑇𝐴 Claimed g Ca2+/AA in Orange Juice Example 0.007042𝑔𝐶𝑎2+ = 0.500𝑔𝐶𝑎2+ 1𝑓𝑙. 𝑜𝑧. 5 𝑚𝐿 𝑝𝑢𝑟𝑒 × × 12 𝑓𝑙. 𝑜𝑧. 29.5735 𝑚𝐿 𝑠𝑎𝑚𝑝𝑙𝑒 Grams Ca2+ in Orange Juice Example ̅𝐸𝐷𝑇𝐴 × 0.009923𝑔𝐶𝑎2+ = 0.02398𝐿𝐸𝐷𝑇𝐴 × 𝑀 40.078𝑔𝐶𝑎2+ 1𝑚𝑜𝑙𝐶𝑎2+ Molarity of KIO3 Example 1𝑚𝑜𝑙 ÷ 2.000𝐿𝑠𝑜𝑙𝑛 214𝑔 0.01002𝑀𝐾𝐼𝑂3 = 4.2888𝑔𝐾𝐼𝑂3 × 1𝑚𝑜𝑙 ÷ 2.00𝐿𝑠𝑜𝑙𝑛 214𝑔 Molarity of Na2S2O3 Equation Molarity of Na2S2O3 Example 𝑀𝑁𝑎2𝑆2𝑂3 = 𝑀𝐾𝐼𝑂3 × 𝐿𝐾𝐼𝑂3 𝑎𝑑𝑑𝑒𝑑 × 3𝑚𝑜𝑙𝐼3− 2𝑚𝑜𝑙𝑆2𝑂32− × 1𝑚𝑜𝑙𝐼𝑂3− 1𝑚𝑜𝑙𝐼3− 0.07704𝑀 = 0.01002𝑀 × 0.05𝐿 × 3𝑚𝑜𝑙 2𝑚𝑜𝑙 × ÷ 0.03902𝐿 1𝑚𝑜𝑙 1𝑚𝑜𝑙 ÷ ∆𝑉𝑁𝑎2𝑆2𝑂3 Moles I3- Produced Equation Moles I3- Produced Example 𝑚𝑜𝑙𝐼3− = 𝑀𝐾𝐼𝑂3 × 𝐿𝐾𝐼𝑂3 𝑎𝑑𝑑𝑒𝑑 × 3𝑚𝑜𝑙𝐼3− 1𝑚𝑜𝑙𝐼𝑂3− 0.0001503𝑚𝑜𝑙 = 0.01002𝑀𝐾𝐼𝑂3 × 0.005𝐿𝐾𝐼𝑂3 𝑎𝑑𝑑𝑒𝑑 × Moles I3- Consumed Equation Moles I3- Consumed Example ̅𝑁𝑎2𝑆2𝑂3 × 𝐿𝑁𝑎2𝑆2𝑂3 × 𝑚𝑜𝑙𝐼3−𝑐𝑜𝑛𝑠𝑢𝑚𝑒𝑑 = 𝑀 1𝑚𝑜𝑙𝐼3− 2𝑚𝑜𝑙𝑆2𝑂32− Moles I3- Remaining/Moles Ascorbic Acid Equation Mass of Ascorbic Acid Example 176.1256𝑔𝐴.𝐴. 1𝑚𝑜𝑙𝐴.𝐴. 0.002199𝑔𝐴.𝐴. = 1.2486 × 10⁻⁵ 𝑚𝑜𝑙𝐴.𝐴. × Mass of Ascorbic Acid Expected Equation 176.1256𝑔𝐴.𝐴. 1𝑚𝑜𝑙𝐴.𝐴. Mass of Ascorbic Acid Example 150%𝐷𝑉 0.060𝑔 1 𝑓𝑙. 𝑜𝑧. 25 𝑚𝐿 × × × + 𝑔𝑠𝑝𝑖𝑘𝑒 100% 12 𝑓𝑙. 𝑜𝑧. 29.5735 𝑚𝐿 𝑠𝑎𝑚𝑝𝑙𝑒 % Difference Equation % 𝐷𝑖𝑓𝑓𝑒𝑟𝑒𝑛𝑐𝑒 = 1𝑚𝑜𝑙 2𝑚𝑜𝑙 1.2486 × 10⁻⁵ 𝑚𝑜𝑙 = 0.0001503𝑚𝑜𝑙 − 0.0001378𝑚𝑜𝑙 Mass of Ascorbic Acid Equation 𝑔𝐴𝐴 = ̅ × 0.00358𝐿 × 0.0001378𝑚𝑜𝑙 = 0.07700𝑀 Moles I3- Remaining/Moles Ascorbic Acid Example 𝑚𝑜𝑙𝐼3−&𝐴.𝐴. = 𝑚𝑜𝑙𝐼3−(𝑝𝑟𝑜𝑑) − 𝑚𝑜𝑙𝐼3−(𝑐𝑜𝑛𝑠𝑢𝑚𝑒𝑑) 𝑚𝑎𝑠𝑠𝐴.𝐴. = 𝑚𝑜𝑙𝐴.𝐴. × 3𝑚𝑜𝑙 1𝑚𝑜𝑙 0.006338𝑔𝐴𝐴 = 150%𝐷𝑉 0.060𝑔 1 𝑓𝑙. 𝑜𝑧. × × 100% 12 𝑓𝑙. 𝑜𝑧. 29.5735 𝑚𝐿 25 𝑚𝐿 × 𝑠𝑎𝑚𝑝𝑙𝑒 % Difference Example |𝑡𝑟𝑢𝑒 − 𝑒𝑥𝑝𝑒𝑟𝑖𝑚𝑒𝑛𝑡𝑎𝑙| × 100% 𝑡𝑟𝑢𝑒 65.30% 𝐷𝑖𝑓𝑓𝑒𝑟𝑒𝑛𝑐𝑒 = |0.002199𝑔 − 0.006338𝑔| × 100% 0.006338𝑔 Summary of Calculations: EDTA: Standardization 1 EDTA: Tropicana 0.5052g CaCO3 to 100mL with ~0.1M HCl Vol. EDTA Trial Molarity EDTA Added 1 14.66 mL 0.010329359 M Calcium & Vit. D 2 14.64 mL 3 Trial Vol. EDTA added 1 23.98 mL Grams of Calcium 0.009925500 g 0.010343471 M 2 23.94 mL 0.009908944 g 40.70700116% 14.69 mL 0.010308265 M 3 23.69 mL 0.009805467 g 39.23762981% Average 0.010327032 M 4 23.67 mL 0.009797189 g 39.12008010% Average 40.00170291% Molarity CaCO3: 0.050476136M Manufacturer’s Claim: 0.007042254g Ca2+ per sample EDTA: Standardization 2 EDTA: Tropicana 0.5052g CaCO3 to 100mL with ~0.1M HCl Vol. EDTA Trial Molarity EDTA Added 1 14.61 mL 0.010364710 M Calcium & Vit. D w/ Spike 2 14.70 mL 3 % Difference 40.94210058% Trial Vol. EDTA added 1 21.54 mL Grams of Calcium 0.008929833 g 0.010301252 M 2 21.61 mL 0.008958853 g 18.38912298% 14.61 mL 0.010364710 M 3 21.49 mL 0.008909104 g 17.73170999% Average 0.010343557 M Average 18.04215501% Manufacturer’s Claim: 0.003521127g Ca2+ from OJ + 0.004046167g Ca2+ from CaCO3 = 0.007567294g Ca2+ per sample Molarity CaCO3: 0.050476136M % Difference 18.00563207% Thiosulfate: Standardization 1 Thiosulfate: Tropicana 4.2888 g KIO3 diluted to 2 L with dH2O Vol. Na2S2O3 Molarity Trial Added Na2S2O3 1 39.02 mL 0.077041368 M Calcium & Vit. D Vol. Na2S2O3 Trial Added 1 3.58 mL Consumed Moles I30.000137822 Moles I3Present 1.24859E-05 Grams Ascorbic Acid 0.002199092 2 39.10 mL 0.076883739 M 2 3.56 mL 0.000137052 1.32559E-05 0.002334700 63.16361710% 3 39.01 mL 0.077061117 M 3 3.45 mL 0.000132817 1.74906E-05 0.003080548 51.39580206% Average 0.076995408 M Average Manufacturer’s Claim: 0.006338028g AA per sample Moles I3- formed: 0.0001503 mol 0.002538113 59.95421300% Grams Ascorbic Acid % Difference Molarity KIO3: 0.010020514M % Difference 65.30321983% Thiosulfate: Standardization 2 Thiosulfate: Tropicana 4.2888 g KIO3 diluted to 2 L with dH2O Vol. Na2S2O3 Molarity Trial Added Na2S2O3 1 38.21 mL 0.078674540 M Regular 1 3.18 mL 0.000124261 2.60470E-05 0.004587547 27.61870362% 2 38.56 mL 0.077960430 M 2 3.21 mL 0.000125433 2.48747E-05 0.004381080 30.87629205% 3 38.63 mL 0.077819161 M 3 3.28 mL 0.000128168 2.21395E-05 0.003899324 38.47733171% Average 0.078151377 M Average Manufacturer’s Claim: 0.006338028g AA per sample Moles I3- formed: 0.0001503 mol 0.004289317 32.32410912% Molarity KIO3: 0.010020514M Trial Vol. Na2S2O3 Added Consumed Moles I3- Moles I3Present Thiosulfate: Tropicana Calcium & Vit. D w/ Spike 0.006869014 g Vol. Na2S2O3 Added 3.44 mL Consumed Moles I30.000134420 Moles I3Present 1.58873E-05 Grams Ascorbic Acid 0.002798167 g 0.007069014 g 3.39 mL 0.000132467 1.78411E-05 0.003142279 g 55.54855584% 0.006669014 g 3.39 mL 0.000132467 1.78411E-05 0.003142279 g 52.88240797% Average 0.003027575 g 55.89829304% Trial Total Mass AA 1 2 3 % Difference 59.26391531% Moles I3- Formed: 0.000150308 mol Manufacturer's Claim: 0.003169014g AA per sample Thiosulfate: Tropicana Regular w/ Spike 0.006869014 g Vol. Na2S2O3 Added 3.23 mL Consumed Moles I30.000126214 Moles I3Present 2.40932E-05 Grams Ascorbic Acid 0.004243436 g 2 0.007269014 g 3.17 mL 0.000123870 2.64378E-05 0.004656369 g 35.94221733% 3 0.006869014 g 3.20 mL 0.000125042 2.52655E-05 0.004449902 g 35.21774279% Average 0.004449902 g 36.46115816% Trial Total Mass AA 1 % Difference 38.22351435% Moles I3- Formed: 0.000150308 mol Manufacturer's Claim: 0.003169014g AA per sample Conclusions: This experiment was relatively unsuccessful. After trying several different procedures, it was discovered that Tropicana orange juice contains particles much too large for typical filtration techniques, and the simulating digestion using ~0.1M hydrochloric acid was necessary to obtain valuable results. The particles in the orange juice were also so large that they obscured the endpoint of the titrations, indicating that centrifuging was necessary. Unfortunately, although the titrations were partially successful after filtering through glass wool, simulating digestion, and centrifuging the samples, the numbers did not match what was expected. For the titration of the Tropicana Calcium Plus Vitamin D orange juice with EDTA, the calculated Calcium content was much higher than was expected. After doing a bit of research, it was found that this orange juice has a fair amount of Magnesium, which could potentially have bound to the EDTA, as well. In the future, it may be beneficial to amend this procedure to include back titration to quantify the amount of Magnesium present in the sample, in order to obtain a more true value for the Calcium content. The EDTA titration with Tropicana Regular orange juice was unsuccessful. It was necessary to use a much larger sample size for the Regular orange juice, given that the manufacturer’s claim as to the Calcium content was significantly lower than the claim for the Calcium Plus Vitamin D variety. It may be useful to spike this sample with a significant amount of Calcium Carbonate to reduce the sample size per titration. It may also be beneficial to back-titrate this spiked sample with EDTA, in order to quantify the Magnesium content. The iodimetric titrations with both varieties of Tropicana orange juice yielded very low numbers for ascorbic acid (Vitamin C) content. It is presumed that the ascorbic acid may contain particles large enough to become part of the pellet during the centrifuging process. Because only the supernatant was titrated, a large amount of the ascorbic acid may have been absent in the titrations, leading to the consistently low numbers which were obtained from calculation. However, the spiked titrations remain a mystery. Although there were ~0.003g of ascorbic acid present in solid form in each of the spiked titrations, the calculations yielded values for ascorbic acid content which were lower than this value. While it is plausible that the non-spiked titrations had a loss of product during the centrifuging process, it is, as of yet, undetermined how the loss of product occurred in the spiked samples.
