recallprecision
advertisement
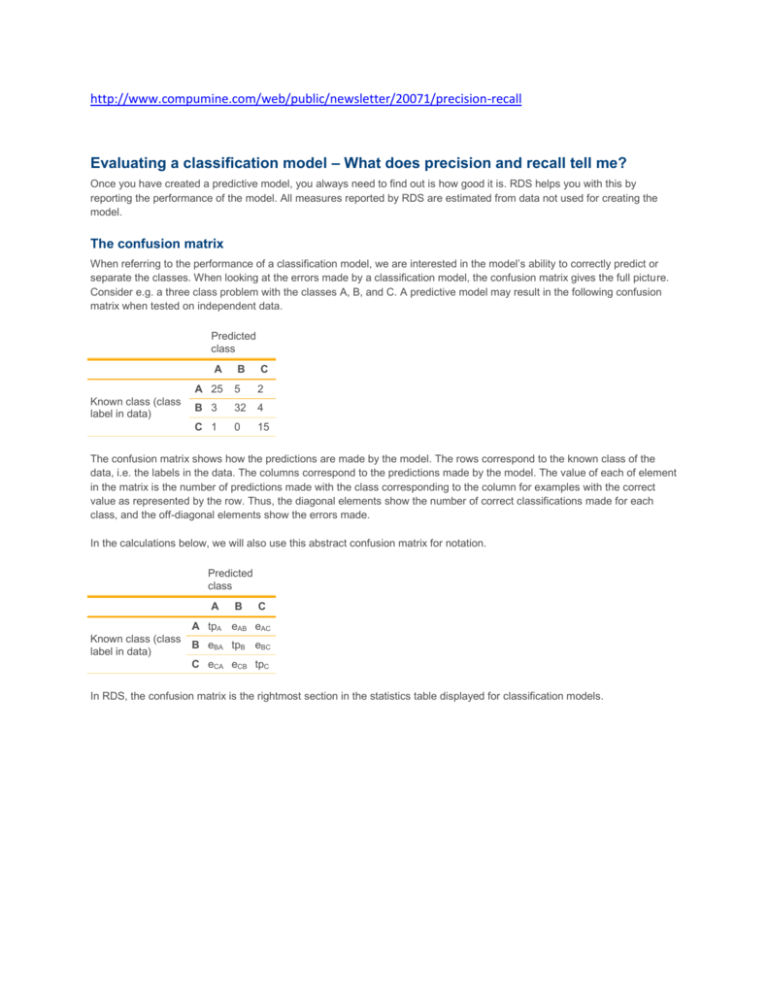
http://www.compumine.com/web/public/newsletter/20071/precision-recall Evaluating a classification model – What does precision and recall tell me? Once you have created a predictive model, you always need to find out is how good it is. RDS helps you with this by reporting the performance of the model. All measures reported by RDS are estimated from data not used for creating the model. The confusion matrix When referring to the performance of a classification model, we are interested in the model’s ability to correctly predict or separate the classes. When looking at the errors made by a classification model, the confusion matrix gives the full picture. Consider e.g. a three class problem with the classes A, B, and C. A predictive model may result in the following confusion matrix when tested on independent data. Predicted class A Known class (class label in data) B C A 25 5 2 B 3 32 4 C 1 0 15 The confusion matrix shows how the predictions are made by the model. The rows correspond to the known class of the data, i.e. the labels in the data. The columns correspond to the predictions made by the model. The value of each of element in the matrix is the number of predictions made with the class corresponding to the column for examples with the correct value as represented by the row. Thus, the diagonal elements show the number of correct classifications made for each class, and the off-diagonal elements show the errors made. In the calculations below, we will also use this abstract confusion matrix for notation. Predicted class A B C A tpA eAB eAC Known class (class label in data) B eBA tpB eBC C eCA eCB tpC In RDS, the confusion matrix is the rightmost section in the statistics table displayed for classification models. Performance measures Accuracy Accuracy is the overall correctness of the model and is calculated as the sum of correct classifications divided by the total number of classifications. Precision Precision is a measure of the accuracy provided that a specific class has been predicted. It is defined by: Precision = tp/(tp + fp) where tp and fp are the numbers of true positive and false positive predictions for the considered class. In the confusion matrix above, the precision for the class A would be calculated as: PrecisionA = tpA/(tpA+eBA+eCA) = 25/(25+3+1) ≈ 0.86 The number is reported by RDS as a value between 0 and 1. Recall Recall is a measure of the ability of a prediction model to select instances of a certain class from a data set. It is commonly also called sensitivity, and corresponds to the true positive rate. It is defined by the formula: Recall = Sensitivity = tp/(tp+fn) where tp and fn are the numbers of true positive and false negative predictions for the considered class. tp + fn is the total number of test examples of the considered class. For class A in the matrix above, the recall would be: RecallA = SensitivityA = tpA/(tpA+eAB+eAC) = 25/(25+5+2) ≈ 0.78 Specificity Recall/sensitivity is related to specificity, which is a measure that is commonly used in two class problems where one is more interested in a particular class. Specificity corresponds to the true-negative rate. Specificity = tn/(tn+fp) For class A, the specificity would correspond to the true-negative rate for class A (as in not being a member of class A) and be calculated as: SpecificityA = tnA/(tnA+eBA+eCA), where tnA = tpB + eBC + eCB + tpC = 32+4+0+15 = 51 SpecificityA = 51/(51+3+1) ≈ 0.93 If you look at the formula, you may realize that Specificity for class A is actually the same thing as the Recall or Sensitivity of the inverted class 'Not member of A'. This means that in a two class problem, the specificity of one class is the same as the recall of the other. Specificity in multi class problem is related to multiple classes, and is not reported by RDS in order to avoid the type of confusion I hope that you are not experiencing now... Pay attention to these measures Depending on what is most important for you, to be sure of having a case of a particular class when getting the prediction, or to accept a few cases to many as long as you are sure that you get the most cases, you should use these measures to select the model with the best properties. We also recommend using the class probabilities for selecting your cases based on predictions. In order to do this, the lift chart, the Receiver-Operating Characteristic (ROC) curve, and the measure Area Under Curve (AUC), are instrumental. This topic will be covered in a later newsletter, but you can read more about it in the manuals for RDS.
