File - TaiSee Island
advertisement
Accel Analytic Geometry
Applications of Probability
Unit 3
How Odd?
Name: _________________________
Date: ____________ Period: _______
Standards Addressed in this Task
MGSE9-12.S.CP.1 Describe categories of events as subsets of a sample space using unions, intersections, or complements of
other events (or, and, not).
MGSE9-12.S.CP.7 Apply the Addition Rule, P(A or B) = P(A) + P(B) – P(A and B), and interpret the answers in context.
Part 1 – For this task you will need a pair of six-sided dice. In Part 1, you will be concerned with the probability that one (or both)
of the dice show odd values.
1. Roll your pair of dice 30 times, each time recording a success if one (or both) of the dice show an odd number and a failure if
the dice do not show an odd number.
Number of Successes
Number of Failures
2. Based on your trials, what would you estimate the probability of two dice showing at least one odd number? Explain your
reasoning.
3. You have just calculated an experimental probability. 30 trials are generally sufficient to estimate the theoretical probability,
the probability that you expect to happen based upon fair chance. For instance, if you flip a coin ten times you expect the coin
to land heads and tails five times apiece; in reality, we know this does not happen every time you flip a coin ten times.
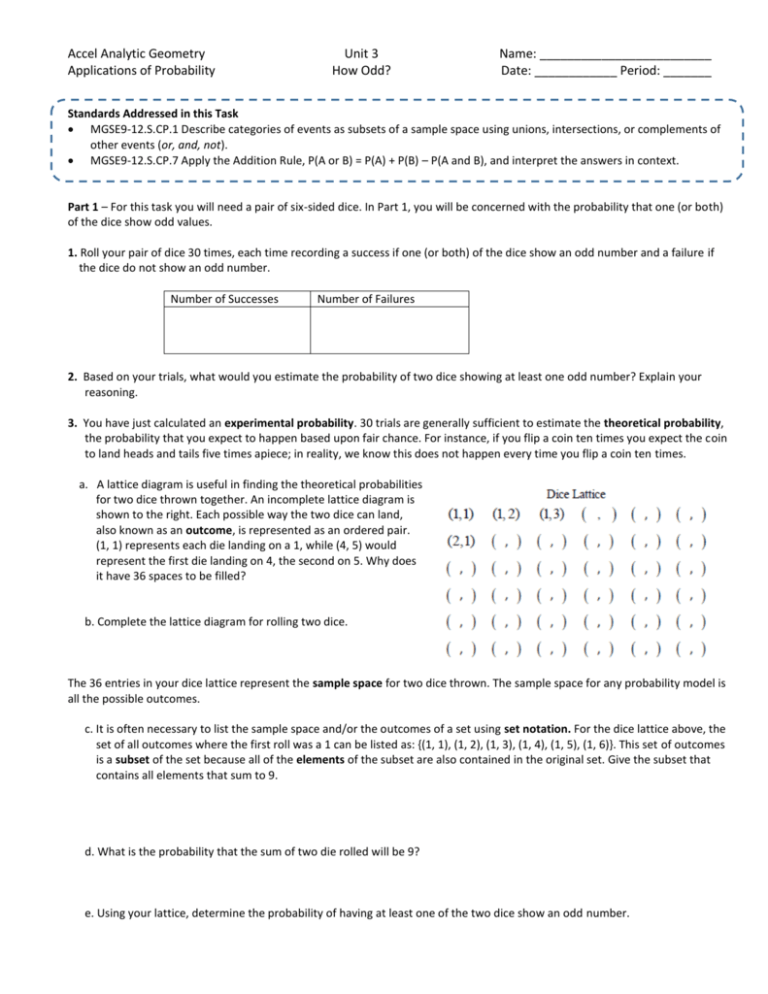
a. A lattice diagram is useful in finding the theoretical probabilities
for two dice thrown together. An incomplete lattice diagram is
shown to the right. Each possible way the two dice can land,
also known as an outcome, is represented as an ordered pair.
(1, 1) represents each die landing on a 1, while (4, 5) would
represent the first die landing on 4, the second on 5. Why does
it have 36 spaces to be filled?
b. Complete the lattice diagram for rolling two dice.
The 36 entries in your dice lattice represent the sample space for two dice thrown. The sample space for any probability model is
all the possible outcomes.
c. It is often necessary to list the sample space and/or the outcomes of a set using set notation. For the dice lattice above, the
set of all outcomes where the first roll was a 1 can be listed as: {(1, 1), (1, 2), (1, 3), (1, 4), (1, 5), (1, 6)}. This set of outcomes
is a subset of the set because all of the elements of the subset are also contained in the original set. Give the subset that
contains all elements that sum to 9.
d. What is the probability that the sum of two die rolled will be 9?
e. Using your lattice, determine the probability of having at least one of the two dice show an odd number.
Accel Analytic Geometry
Applications of Probability
Unit 3
How Odd?
Name: _________________________
Date: ____________ Period: _______
4. The different outcomes that determine the probability of rolling odd can be visualized using a Venn diagram, the beginning of
which is seen below. Each circle represents the possible ways that each die can land on an odd number. Circle A is for the first
die landing on an odd number and circle B for the second die landing on odd. The circles overlap because some rolls of the two
dice are successes for both dice. In each circle, the
overlap, and the area outside the circles, one of the
ordered pairs from the lattice has been placed. (1, 4)
appears in circle A because the first die is odd, appears
in circle B because the second die is odd, appears in
both circles at the same time (the overlap) because each
die is odd, and appears outside of the circles because
neither dice is odd. (1, 4) appears in circle A because the
first die is odd, (6, 3) , appears in circle B because the
second die is odd, (5, 1) appears in both circles at the
same time (the overlap) because each die is odd, and (2,
6) appears outside of the circles because neither dice is
odd.
a. Finish the Venn diagram by placing the remaining 32
ordered pairs from the dice lattice in the appropriate
place.
b. How many outcomes appear in circle A? (Remember, if ordered pairs appear in the overlap, they are still within circle A).
c. How many outcomes appear in circle B?
d. The portion of the circles that overlap is called the intersection. The notation used for intersections is ∩. For this Venn
diagram the intersection of A and B is written A∩B and is read as “A intersect B” or “A and B.” How many outcomes are in
A∩B?
e. When you look at different parts of a Venn diagram together, you are considering the union of the two outcomes. The
notation for unions is ∪, and for this diagram the union of A and B is written A∪B and is read “A union B” or “A or B.” In the
Venn diagram you created, represents all the possible outcomes where an odd number shows. How many outcomes are in
the union A∪B?
f. Record your answers to b, c, d, and e in the table below.
b. Circle A
c. Circle B
d. A∩B
e. A∪B
g. How is your answer to e related to your answers to b, c, and d?
h. Based on what you have seen, make a conjecture about the relationship of A, B, A∩B, and A∪B using the notation you just
learned.
i. What outcomes fall outside of A∪B (outcomes we have not yet used? Why haven’t you used these outcomes yet?
Accel Analytic Geometry
Applications of Probability
Unit 3
How Odd?
Name: _________________________
Date: ____________ Period: _______
In a Venn diagram the set of outcomes that are not included in some set is called the complement of that set. The notation used
̅, read “A bar” or ~A, read “not A”. For example, in the Venn diagram you completed above, the
for the complement of set A is A
outcomes that are outside of A∪B are denoted ̅̅̅̅̅̅̅̅
A∪B.
̅-B?
j. Which outcomes appear in A
̅̅̅̅̅̅̅
̅ − (𝐴
k. Which outcomes appear in B
∪ 𝐵 )?
5. The investigation of the Venn Diagram in question 4 should reveal a new way to see that the probability of rolling at least one
odd number on two dice is
27
36
3
= . How does the Venn diagram show this probability?
4
6. Venn Diagrams can also be drawn using
probabilities rather than outcomes. The
Venn diagram below represents the
probabilities associated with throwing two
dice together. In other words, we will now
look at the same situation as we did before,
but with a focus on probabilities instead of
outcomes.
a. Fill in the remaining probabilities in the
Venn diagram.
b. Find P(A ∪ B) and explain how you can
use the probabilities in the Venn diagram
rather than counting outcomes.
c. Use the probabilities in the Venn diagram
̅).
to find P(B
̅)? Will this be true for any set and its complement?
d. What relationship do you notice between P(B) and P(B
