Chapter 15 Common Ion Effect
advertisement
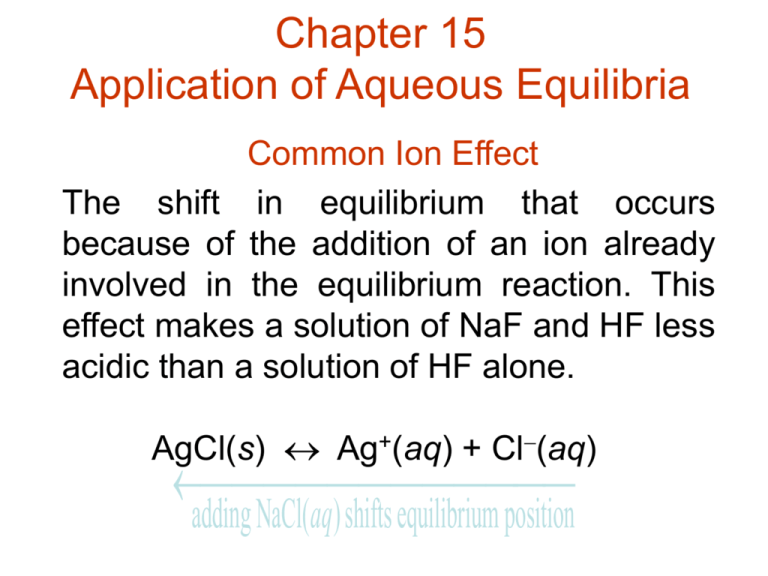
Chapter 15 Application of Aqueous Equilibria Common Ion Effect The shift in equilibrium that occurs because of the addition of an ion already involved in the equilibrium reaction. This effect makes a solution of NaF and HF less acidic than a solution of HF alone. AgCl(s) Ag+(aq) + Cl(aq) adding NaCl(aq)shifts equilibrium position A Buffered Solution . . . resists a change in its pH when either H+ or OH are added. 1.0 L of 0.50 M H3CCOOH + 0.50 M H3CCOONa pH = 4.74 Adding 0.010 mol solid NaOH raises the pH of the solution to 4.76, a very minor change. Blood can absorb the acids and bases produced in biological reactions without changing its pH. The buffering system in the blood involves HCO3- and H2CO3. Key Points on Buffered Solutions 1. They are weak acids or bases containing a common ion. 2. After addition of strong acid or base, deal with stoichiometry first, then equilibrium. Henderson-Hasselbalch Equation Useful for calculating pH when the [A]/[HA] ratios are known. HA H+ + A [ H ][ A ] [ HA] Ka [ H ] Ka [ HA] [A ] [ HA] log[ H ] log Ka log [ A ] pH pKa log( A / HA ) pKa log( base / acid ) Buffered Solution Characteristics • Buffers contain relatively large amounts of weak acid and corresponding weak base. • Added H+ reacts to completion with the weak base. H+ + A- HA or H+ + B BH+ • Added OH reacts to completion with the weak acid. OH- + HA A- + H2O or OH- + BH+ B + H2O • The pH is determined by the ratio of the concentrations of the weak acid and weak base. Buffering Capacity . . . represents the amount of H+ or OH the buffer can absorb without a significant change in pH. A buffer with a large capacity contains large concentrations of buffering components and can absorb a relatively large amount of protons or hydroxide ions without much pH change. Titration (pH) Curve • The pH changes during an acid-base titration. The progress of an acid-base titration is monitored by a plot of pH of the solution being analyzed as a function of the amount of titrant added. Such a plot is called a pH curve or titration curve. • Equivalence (stoichiometric) point: Enough titrant has been added to react exactly with the solution being analyzed. Strong Acid-Strong Base Titration • Strong acids and strong bases are completely dissociated. • The pH can be calculated at selected points during the course of the titration from concentration and volume used. Net ionic equation for strong acid-strong base is H+(aq) + OH(aq) H2O(l) mol solute mmol solute Molarity L solution mL solution Number of mmol = Volume (mL) x molarity Figure 15.1 The pH Curve for the Titration of 50.0 mL of 0.200 M HNO3 with 0.100 M NaOH Figure 15.2 The pH Curve for the Titration of 100.0 mL of 0.50 M NaOH with 1.0 M HCI Weak Acid - Strong Base Titration Step 1 - A stoichiometry problem reaction is assumed to run to completion then determine remaining species. Step 2 - An equilibrium problem determine position of weak acid equilibrium and calculate pH. Figure 15.3 The pH Curve for the Titration of 50.0 mL of 0.100 M HC2H3O2 with 0.100 M NaOH Figure 15.4 The pH Curves for the Titrations of 50.0-mL Samples of 0.10 M Acids with Various Ka Values with 0.10 M NaOH Acid-Base Indicator . . . marks the end point of a titration by changing color. The equivalence point (defined by the stoichiometry) is not necessarily the same as the end point (where the indicator changes color). Indicators exhibit one color when the proton is attached to the molecule and a different color when the proton is absent. Phenolphthalein is colorless in its HIn (acidic) form and pink in its In- (basic) form. pH = pKa 1 Figure 15.5 The pH Curve for the Titration of 100.0 mL of 0.050 M NH3 with 0.10 M HCI Figure 15.6 The Acid and Base Forms of the Indicator Phenolphthalein Figure 15.8 The Useful pH Ranges for Several Common Indicators Figure 15.9 The pH Curve for the Titration of 100.0 mL of 0.10 M HCI with 0.10 M NaOH Figure 15.10 The pH Curve for the Titration of 50 mL of 0.1 M HC2H3O2 with 0.1 M NaOH Solubility Product For solids dissolving to form aqueous solutions. Bi2S3(s) 2Bi3+(aq) + 3S2(aq) Ksp = solubility product constant and Ksp = [Bi3+]2[S2]3 Solubility Product continued.. “Solubility” = s = concentration of Bi2S3 that dissolves, which equals1/2[Bi3+] and 1/3[S2]. Note: Ksp is constant (at a given temperature) s is variable (especially with a common ion present) Precipitation and Qualitative Analysis • Precipitation is the reverse process of dissolving solids in solutions. From the ion product we can predict whether a precipitate will form when two solutions are mixed. • For CaF2, the expression for ion product is Q = [Ca2+]o[F-]o2 If Q is greater than Ksp precipitation occurs If Q is less than Ksp no precipitation occurs Qualitative Analysis • Qualitative analysis of a mixture containing all the common cations involves first separating them into five major groups based on solubilities. Each group is then treated further to separate and identify the individual ions. Equilibria Involving Complex Ions • Complex Ion: A charged species consisting of a metal ion surrounded by ligands [Lewis bases H2O, NH3, Cl-, CN]. • Coordination Number: Number of ligands attached to a metal ion. [Most common are 6 and 4 ie. Co(H2O)62+, Ni(NH3)62+, CoCl42-, Cu(NH3)4 2+] • Formation (Stability) Constants: The equilibrium constants characterizing the stepwise addition of ligands to metal ions.

