Mean and Variance of Random Variables
advertisement
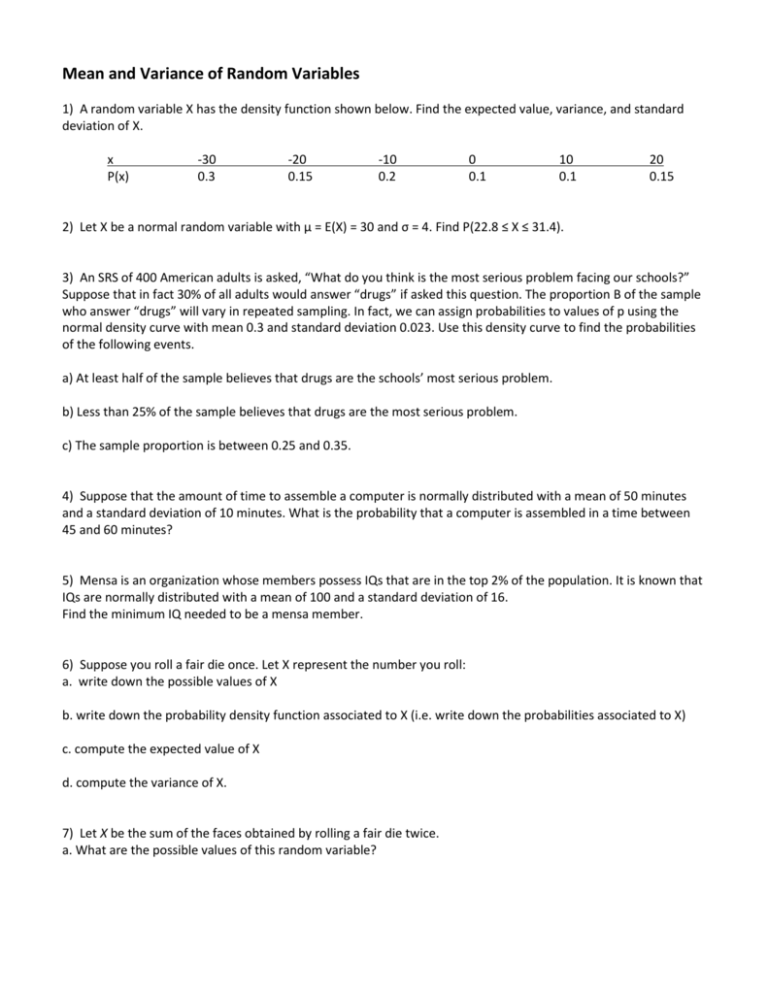
Mean and Variance of Random Variables 1) A random variable X has the density function shown below. Find the expected value, variance, and standard deviation of X. x P(x) -30 0.3 -20 0.15 -10 0.2 0 0.1 10 0.1 20 0.15 2) Let X be a normal random variable with μ = E(X) = 30 and σ = 4. Find P(22.8 ≤ X ≤ 31.4). 3) An SRS of 400 American adults is asked, “What do you think is the most serious problem facing our schools?” Suppose that in fact 30% of all adults would answer “drugs” if asked this question. The proportion B of the sample who answer “drugs” will vary in repeated sampling. In fact, we can assign probabilities to values of p using the normal density curve with mean 0.3 and standard deviation 0.023. Use this density curve to find the probabilities of the following events. a) At least half of the sample believes that drugs are the schools’ most serious problem. b) Less than 25% of the sample believes that drugs are the most serious problem. c) The sample proportion is between 0.25 and 0.35. 4) Suppose that the amount of time to assemble a computer is normally distributed with a mean of 50 minutes and a standard deviation of 10 minutes. What is the probability that a computer is assembled in a time between 45 and 60 minutes? 5) Mensa is an organization whose members possess IQs that are in the top 2% of the population. It is known that IQs are normally distributed with a mean of 100 and a standard deviation of 16. Find the minimum IQ needed to be a mensa member. 6) Suppose you roll a fair die once. Let X represent the number you roll: a. write down the possible values of X b. write down the probability density function associated to X (i.e. write down the probabilities associated to X) c. compute the expected value of X d. compute the variance of X. 7) Let X be the sum of the faces obtained by rolling a fair die twice. a. What are the possible values of this random variable? b. Fill in the table: x P(x) x P(x) c. Use your table to calculate the expected value of the experiment. What does this value mean in terms of this problem? d. Use the chart to compute the following: i. P(X ≤7) ii. P(3<X≤8) iii. P(8≤X≤10) iiii. P(X ≠ 10) 8) Find the expected value of the following game: You are going to draw one card from a deck of playing cards. If you pick a heart, you will win $10. If you pick a face card that is not a heart you will win $8. If you pick any other card, you will lose $6. 9) You roll two dice. If the sum of the faces is eight or more, you win $6. Otherwise you lose $5. Do you want to play? Explain. 10) A company is making light bulbs for flashlights. They know that the probability of one of the bulbs being bad is 1/100. The company makes a profit of $0.80 for every bulb they sell, assuming there is no defective bulbs. However, each defective bulb costs the company $8.00 in replacement charges. How much does the company really make per bulb?
